Fig. 12.
Download original image
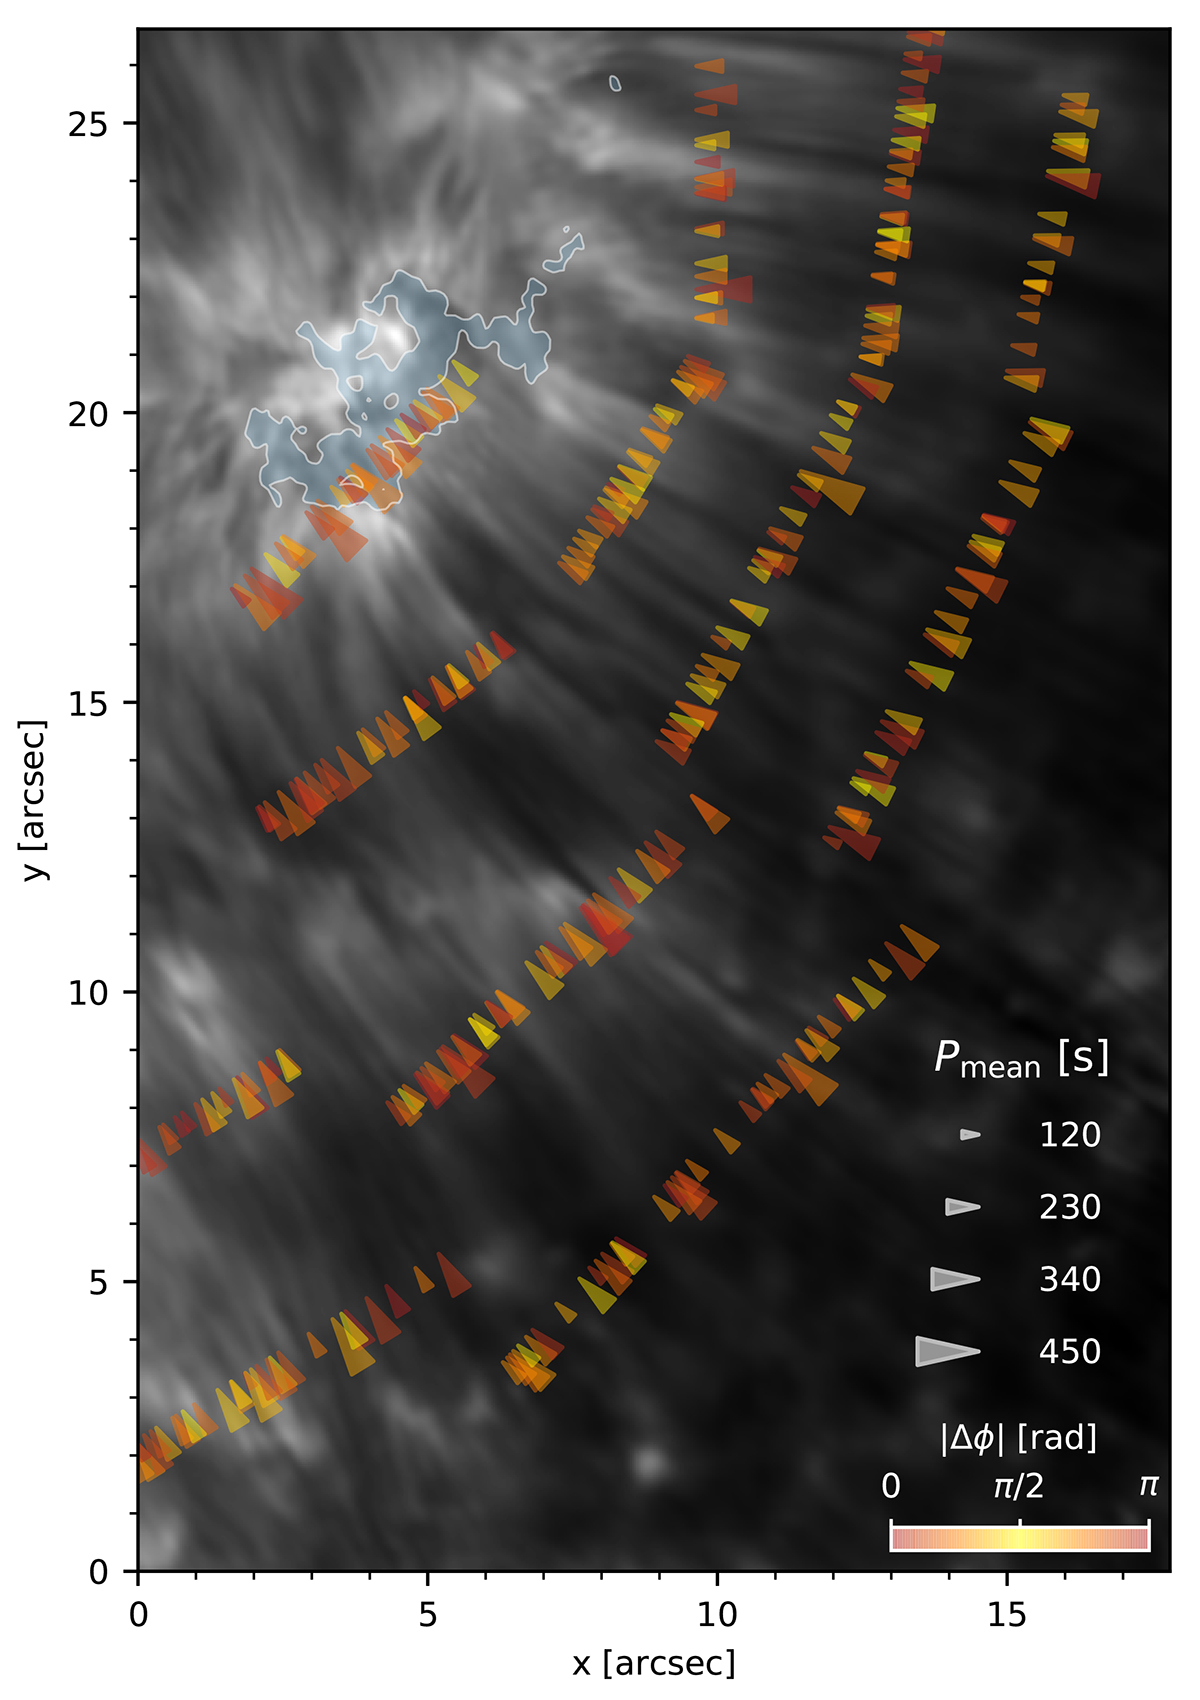
Spatial distribution of measured fibril oscillation periods and LOS-POS phase differences. Each symbol marks the coordinates of the oscillation point. The triangular symbols mark the points where an oscillation is detected in both vPOS and vLOS. The size of the triangular symbols is proportional to their average period. The colour-coding of yellow, orange, and red represents the absolute values of the phase difference between the vLOS and vPOS oscillations where their period is correlated. The coordinates of the oscillations that do not have a clear correlation between their ![]() and
and ![]() are shown with grey triangles. The orientation of the triangular symbols shows the perpendicular direction to the cuts (Fig. 1f) across the bright fibrils. The cross symbols mark the points where an oscillation is detected in the POS direction but not in the LOS direction. The filled white contour lines indicate areas in the photosphere with magnetic concentrations, where the footpoints of the fibrils are located.
are shown with grey triangles. The orientation of the triangular symbols shows the perpendicular direction to the cuts (Fig. 1f) across the bright fibrils. The cross symbols mark the points where an oscillation is detected in the POS direction but not in the LOS direction. The filled white contour lines indicate areas in the photosphere with magnetic concentrations, where the footpoints of the fibrils are located.
Current usage metrics show cumulative count of Article Views (full-text article views including HTML views, PDF and ePub downloads, according to the available data) and Abstracts Views on Vision4Press platform.
Data correspond to usage on the plateform after 2015. The current usage metrics is available 48-96 hours after online publication and is updated daily on week days.
Initial download of the metrics may take a while.