Fig. 1.
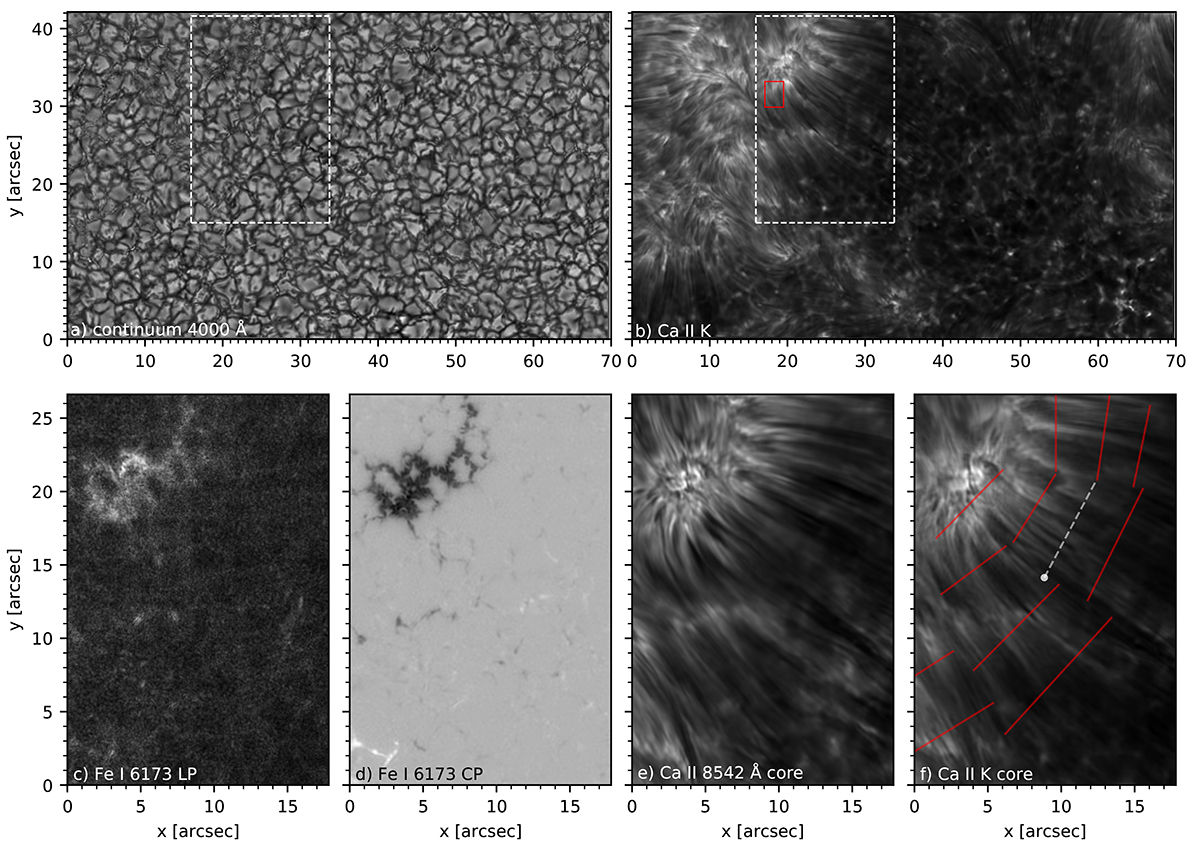
Download original image
Overview of the observations taken on 2018 July 22 at 08:31:49 UT. The top panels show intensity images of the continuum at 4000 Å (a) and the wavelength-integrated Ca II K line intensity (b). The dashed white box marks the region that we analyse in detail. The red box marks the region of interest (RoI) analysed in Fig. 3. A zoom-in of the area enclosed by the dashed white box is shown in the bottom panels. (c) Fe I 6173 Å wavelength-averaged linear polarisation; (d) Fe I 6173 Å wavelength-averaged circular polarisation; (e) Ca II 8542 Å line core intensity; (f) Ca II K line core intensity. The solid red and dashed white lines in panel (f) show the cuts across the Ca II K bright fibrils that we used (see Sect. 3.1). An analysis of the cut along the dashed white line is presented in Figs. 7 and 8. The white dot marks the zero point on the y-axis in Fig. 7. An animated version of this figure showing the entire time sequence is available online.
Current usage metrics show cumulative count of Article Views (full-text article views including HTML views, PDF and ePub downloads, according to the available data) and Abstracts Views on Vision4Press platform.
Data correspond to usage on the plateform after 2015. The current usage metrics is available 48-96 hours after online publication and is updated daily on week days.
Initial download of the metrics may take a while.