| Issue |
A&A
Volume 697, May 2025
|
|
|---|---|---|
| Article Number | C1 | |
| Number of page(s) | 1 | |
| Section | Planets, planetary systems, and small bodies | |
| DOI | https://doi.org/10.1051/0004-6361/202555127e | |
| Published online | 15 May 2025 | |
Effects of the September 2014 coronal mass ejection chain in the inner Solar System and the response of the Martian ionosphere (Corrigendum)
1
Istituto Nazionale di Geofisica e Vulcanologia,
Via di Vigna Murata 605,
00143
Roma,
Italy
2
School of Physics and Astronomy, University of Leicester,
Leicester,
UK
3
Department of Geophysics, Graduate School of Science, Kyoto University,
Kyoto,
Japan
★ Corresponding author: This email address is being protected from spambots. You need JavaScript enabled to view it.
Key words: Sun: heliosphere / Sun: particle emission / solar wind / interplanetary medium / planets and satellites: atmospheres / errata, addenda
Due to a previously unnoticed bug in the IDL code used to generate the figures, the asterisks indicating the flare sites on the magnetogram in the lower two panels of Figure 4 were plotted in incorrect positions. Below, readers can find the corrected version of Figure 4. This error does not affect the data analysis or the scientific results presented in the paper. However, we provide here some additional clarifications to better explain the context. The coronal mass ejection (CME) observed on 9 September 2014, which most likely originated from an M4.5 flare, caused a significant enhancement in the energetic proton fluxes observed at Mars, starting from 10 September (see Fig. 2 of the paper). This is because, based on its propagation direction, the CME shock intersected in less that one day with the magnetic field lines connected to Mars, which, as shown by Mars’s magnetic footpoint plotted in green in the middle panel of Figure 4, span a wide region in space.
The increase in solar proton flux at Mars was observed several hours before a similar rise in 10 MeV proton flux recorded at L1 by SOHO. This can be attributed to Mars being more directly exposed to the energetic particles accelerated by the CME shock front as the Parker spiral footpoint of Mars was closer than Earth’s footpoint, to the flare site responsible for the CME (see middle panel of Figure 4). The same CME did not result in a significant increase in proton fluxes observed by FIPS/MESSENGER at Mercury (see Fig. 2 of the paper). This is mainly due to the CME’s propagation direction and the large angular separation (more than 40∘ in heliographic longitude) between the flare site and Mercury’s Parker spiral footpoint. The CME observed on 10 September 2014, which is associated with an X1.6 solar flare originating from the same active region (AR12158) as the previous day’s event, did not produce a noticeable increase in energetic protons in Mercury’s environment. This is due to the large angular distance (over 60∘ in heliographic longitude) between the active region and Mercury’s Parker spiral footpoint on the solar surface. In contrast, an enhancement in energetic particle fluxes was clearly observed at Mars nearly simultaneously with a sudden increase in proton flux at L1 (see panels c and d of Fig. 2). Although Mars is located farther from the Sun than Earth, its magnetic footpoint (again, shown in green in the middle panel of Figure 4) was located less than 30∘ in heliographic longitude from the flare site. This proximity allowed the CME shock to first reach the region of space connected to Mars’ magnetic field lines, enabling an earlier detection of the event at Mars compared to Earth.
© The Authors 2025
 Open Access article, published by EDP Sciences, under the terms of the Creative Commons Attribution License (https://creativecommons.org/licenses/by/4.0), which permits unrestricted use, distribution, and reproduction in any medium, provided the original work is properly cited.
This article is published in open access under the Subscribe to Open model. This email address is being protected from spambots. You need JavaScript enabled to view it. to support open access publication.
All Figures
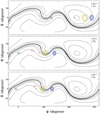 |
Fig. 4 From top to bottom: the magnetic footpoints of the Earth (blue contour lines), Mars (green contour lines), and Mercury (petrol blue contour lines), traced back on the solar surface (4 solar radii) for 1, 9, and 10 September 2014, respectively. Each panel also reports the projection of Earth (blue square), Mars (green square), and Mercury (petrol blue spot) and of the flares site. All of these features are projected on the solar magnetic configuration at the source surface (r = 2.5 Rs) provided by WSO. The red asterisk in each panel represents the site on the solar surface of the flare most likely related to the studied CME. |
| In the text | |
Current usage metrics show cumulative count of Article Views (full-text article views including HTML views, PDF and ePub downloads, according to the available data) and Abstracts Views on Vision4Press platform.
Data correspond to usage on the plateform after 2015. The current usage metrics is available 48-96 hours after online publication and is updated daily on week days.
Initial download of the metrics may take a while.