Open Access
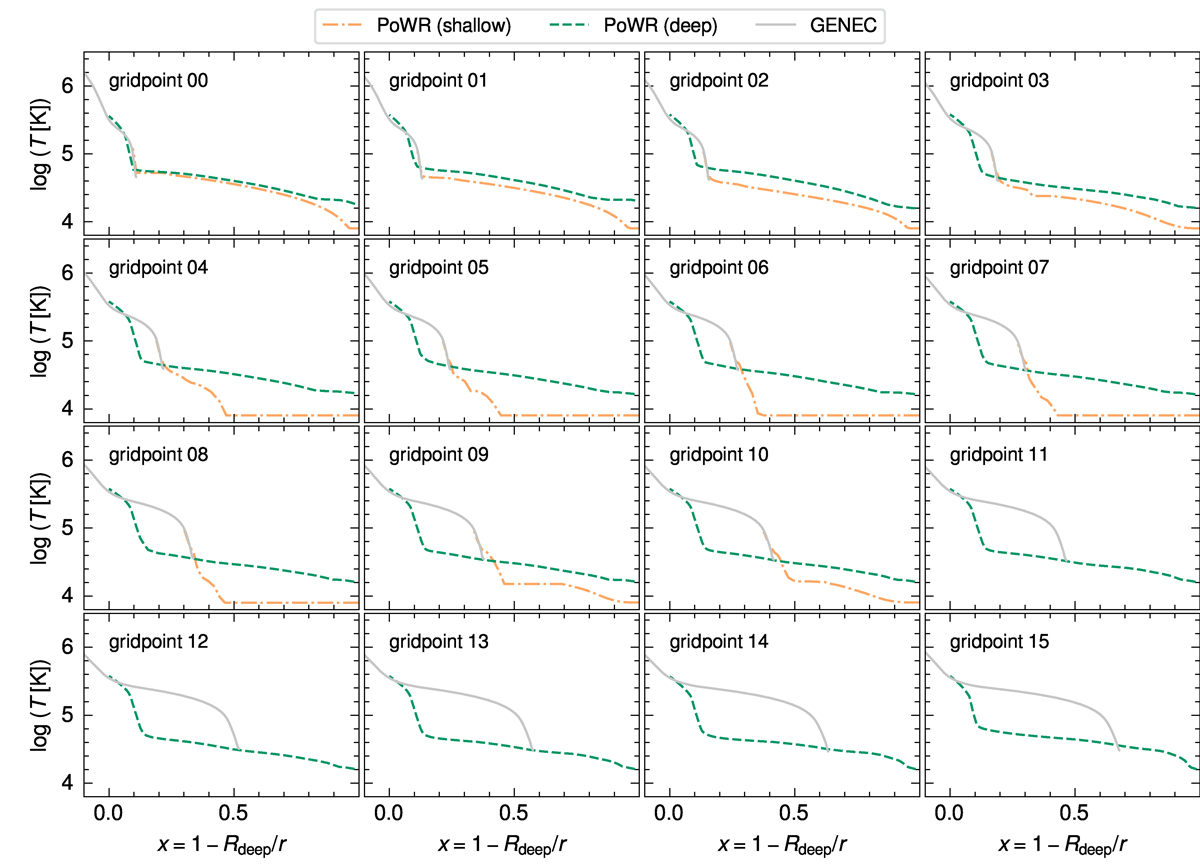
Fig. 7.
Download original image
Temperature stratification across the MS evolution of the two PoWR model series as well as the GENEC structure models. The grid points correspond to the locations shown on the HRD in Fig. 2. For the PoWR models, the electron temperature is shown.
Current usage metrics show cumulative count of Article Views (full-text article views including HTML views, PDF and ePub downloads, according to the available data) and Abstracts Views on Vision4Press platform.
Data correspond to usage on the plateform after 2015. The current usage metrics is available 48-96 hours after online publication and is updated daily on week days.
Initial download of the metrics may take a while.