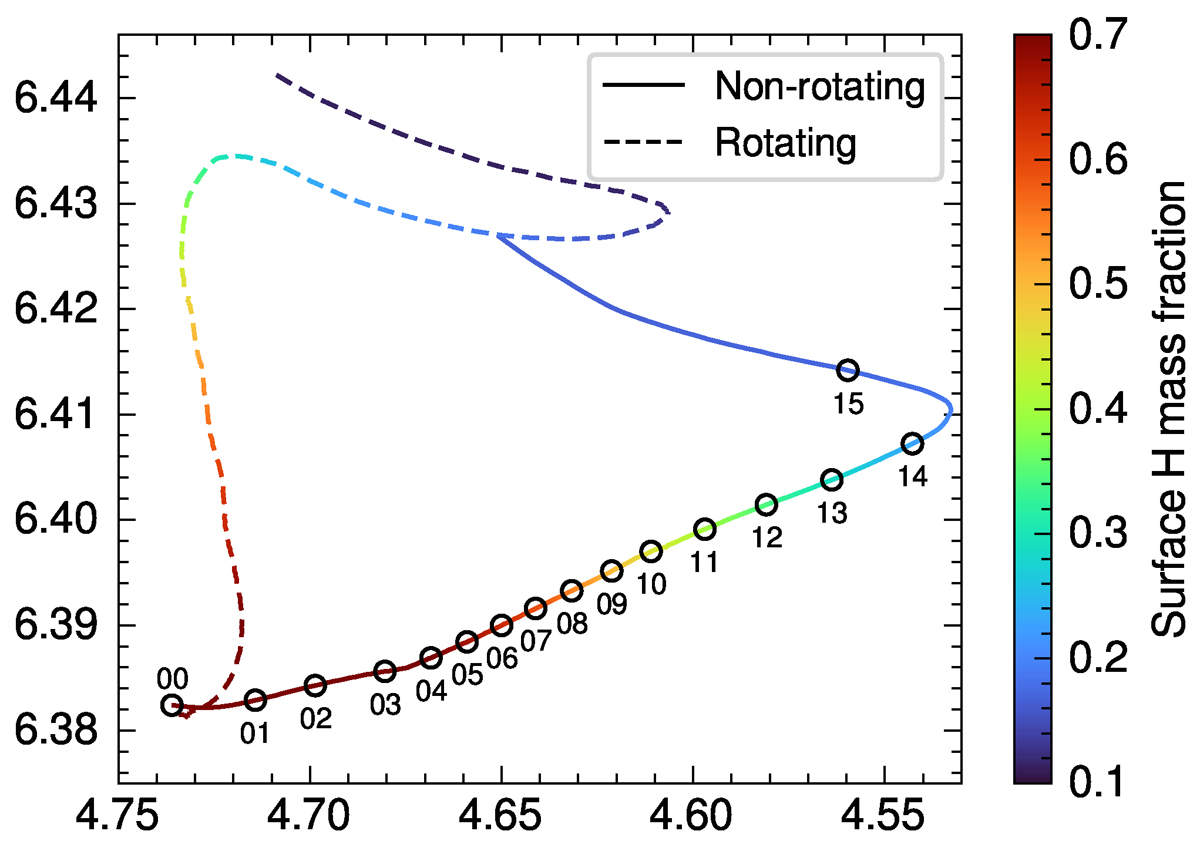
Fig. 2.
Download original image
Hertzsprung-Russell diagram showing the evolution of the 150 M⊙ models computed with GENEC using the new mass-loss scheme. The initial velocity of the rotating model was set at 10% of the critical velocity. The markers (labeled 00−15) represent the evolution snapshots used to compute atmosphere models with PoWR along the nonrotating track. The color of the tracks indicates the evolving surface hydrogen content of the models.
Current usage metrics show cumulative count of Article Views (full-text article views including HTML views, PDF and ePub downloads, according to the available data) and Abstracts Views on Vision4Press platform.
Data correspond to usage on the plateform after 2015. The current usage metrics is available 48-96 hours after online publication and is updated daily on week days.
Initial download of the metrics may take a while.