Fig. 10.
Download original image
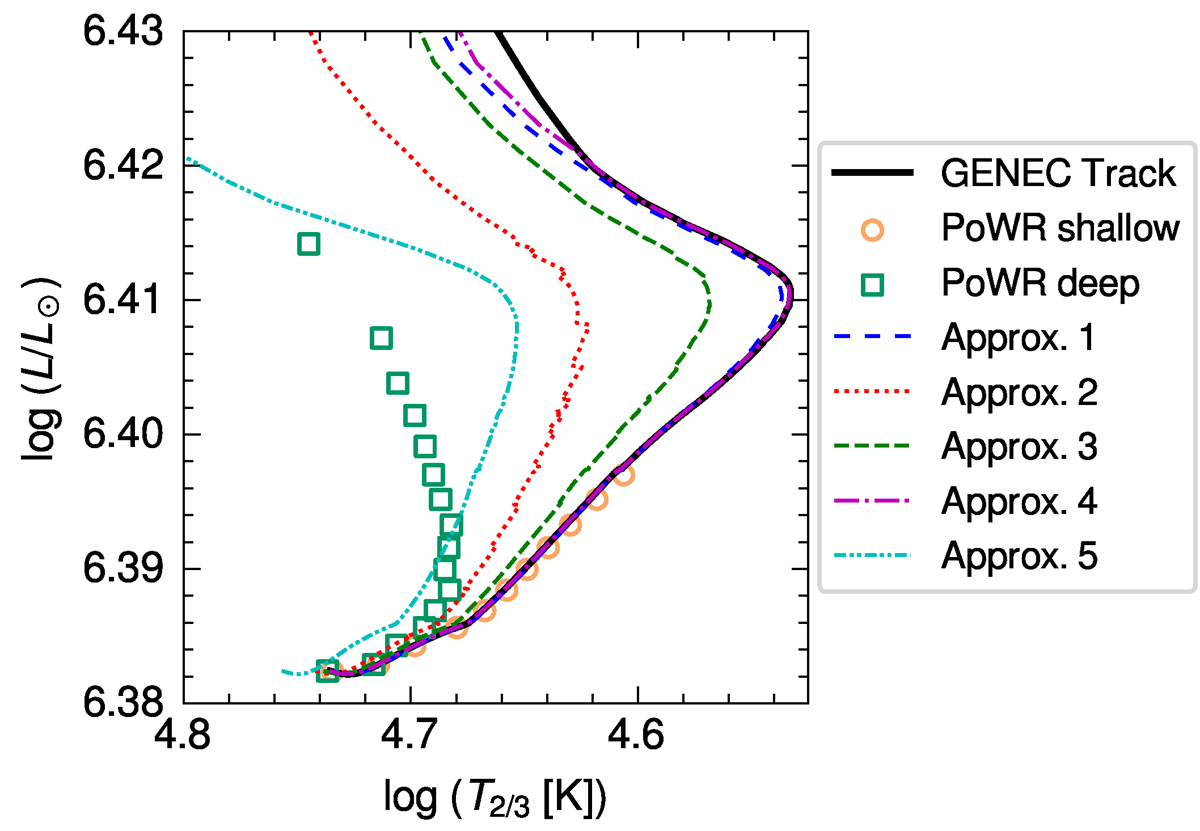
Evolution of the 150 M⊙ star on the HRD using different methods to obtain the effective photospheric temperature T2/3. The solid black line shows the unmodified output of the GENEC track, and the square and circle scatter points show the output of the PoWR deep and shallow model series along the evolutionary track. The five nonsolid lines follow the approximated wind-corrected photospheric temperature calculated from the GENEC structure models via the method outlined in Sect. 5.5 using different assumptions for the connection radius Rcon (see main text for details).
Current usage metrics show cumulative count of Article Views (full-text article views including HTML views, PDF and ePub downloads, according to the available data) and Abstracts Views on Vision4Press platform.
Data correspond to usage on the plateform after 2015. The current usage metrics is available 48-96 hours after online publication and is updated daily on week days.
Initial download of the metrics may take a while.