Fig. 1.
Download original image
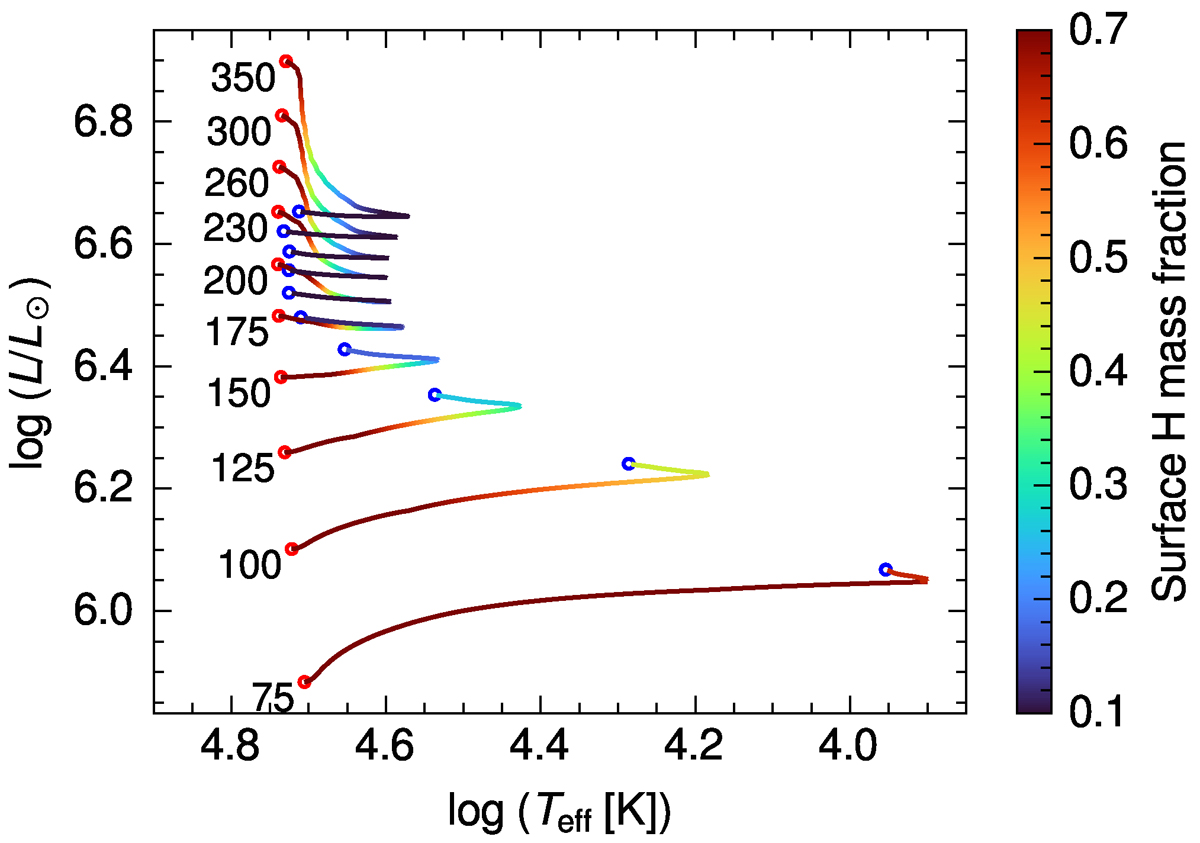
Hertzsprung-Russell diagram showing the evolution of the nonrotating models of potential VMS computed with GENEC using the updated mass-loss scheme. Each track is labeled with the corresponding initial mass (in M⊙). The red and blue markers represent the ZAMS and TAMS, respectively. The color of the tracks indicates the surface hydrogen content across the evolution.
Current usage metrics show cumulative count of Article Views (full-text article views including HTML views, PDF and ePub downloads, according to the available data) and Abstracts Views on Vision4Press platform.
Data correspond to usage on the plateform after 2015. The current usage metrics is available 48-96 hours after online publication and is updated daily on week days.
Initial download of the metrics may take a while.