Fig. 8
Download original image
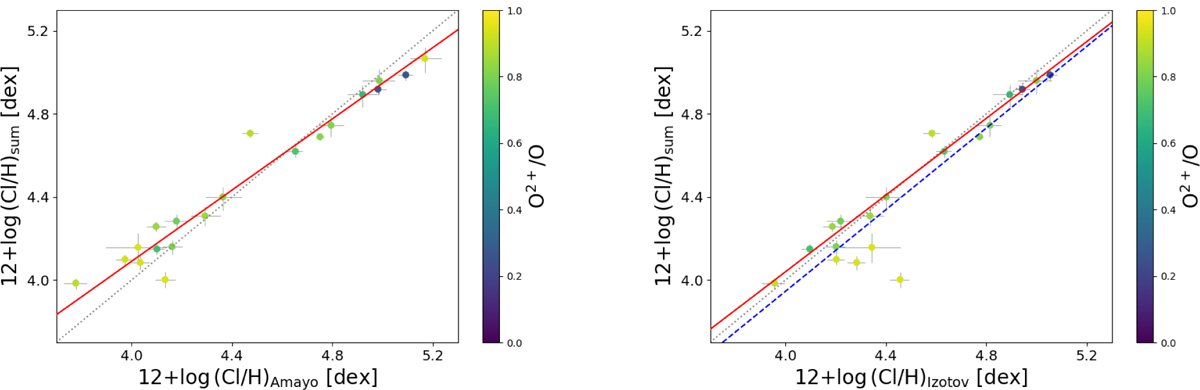
Comparison of total Cl abundances obtained with and without ICF(Cl) for objects where Cl+ and/or Cl3+ abundances have been derived. Left and right panels show the results obtained when the Cl/H ratio is obtained using the ICF(Cl) by Amayo et al. (2021) or Izotov et al. (2006), respectively. Each data point is colour-coded by its ionisation degree and parameterised by the O2+/O ratio. The dotted line indicates the 1:1 relation. The red line in the left panel represents the linear fit to the data points. In the right panel, the dashed blue line represents the linear fit to all objects, and the solid red line represents the fit excluding objects with O2+/O > 0.9.
Current usage metrics show cumulative count of Article Views (full-text article views including HTML views, PDF and ePub downloads, according to the available data) and Abstracts Views on Vision4Press platform.
Data correspond to usage on the plateform after 2015. The current usage metrics is available 48-96 hours after online publication and is updated daily on week days.
Initial download of the metrics may take a while.