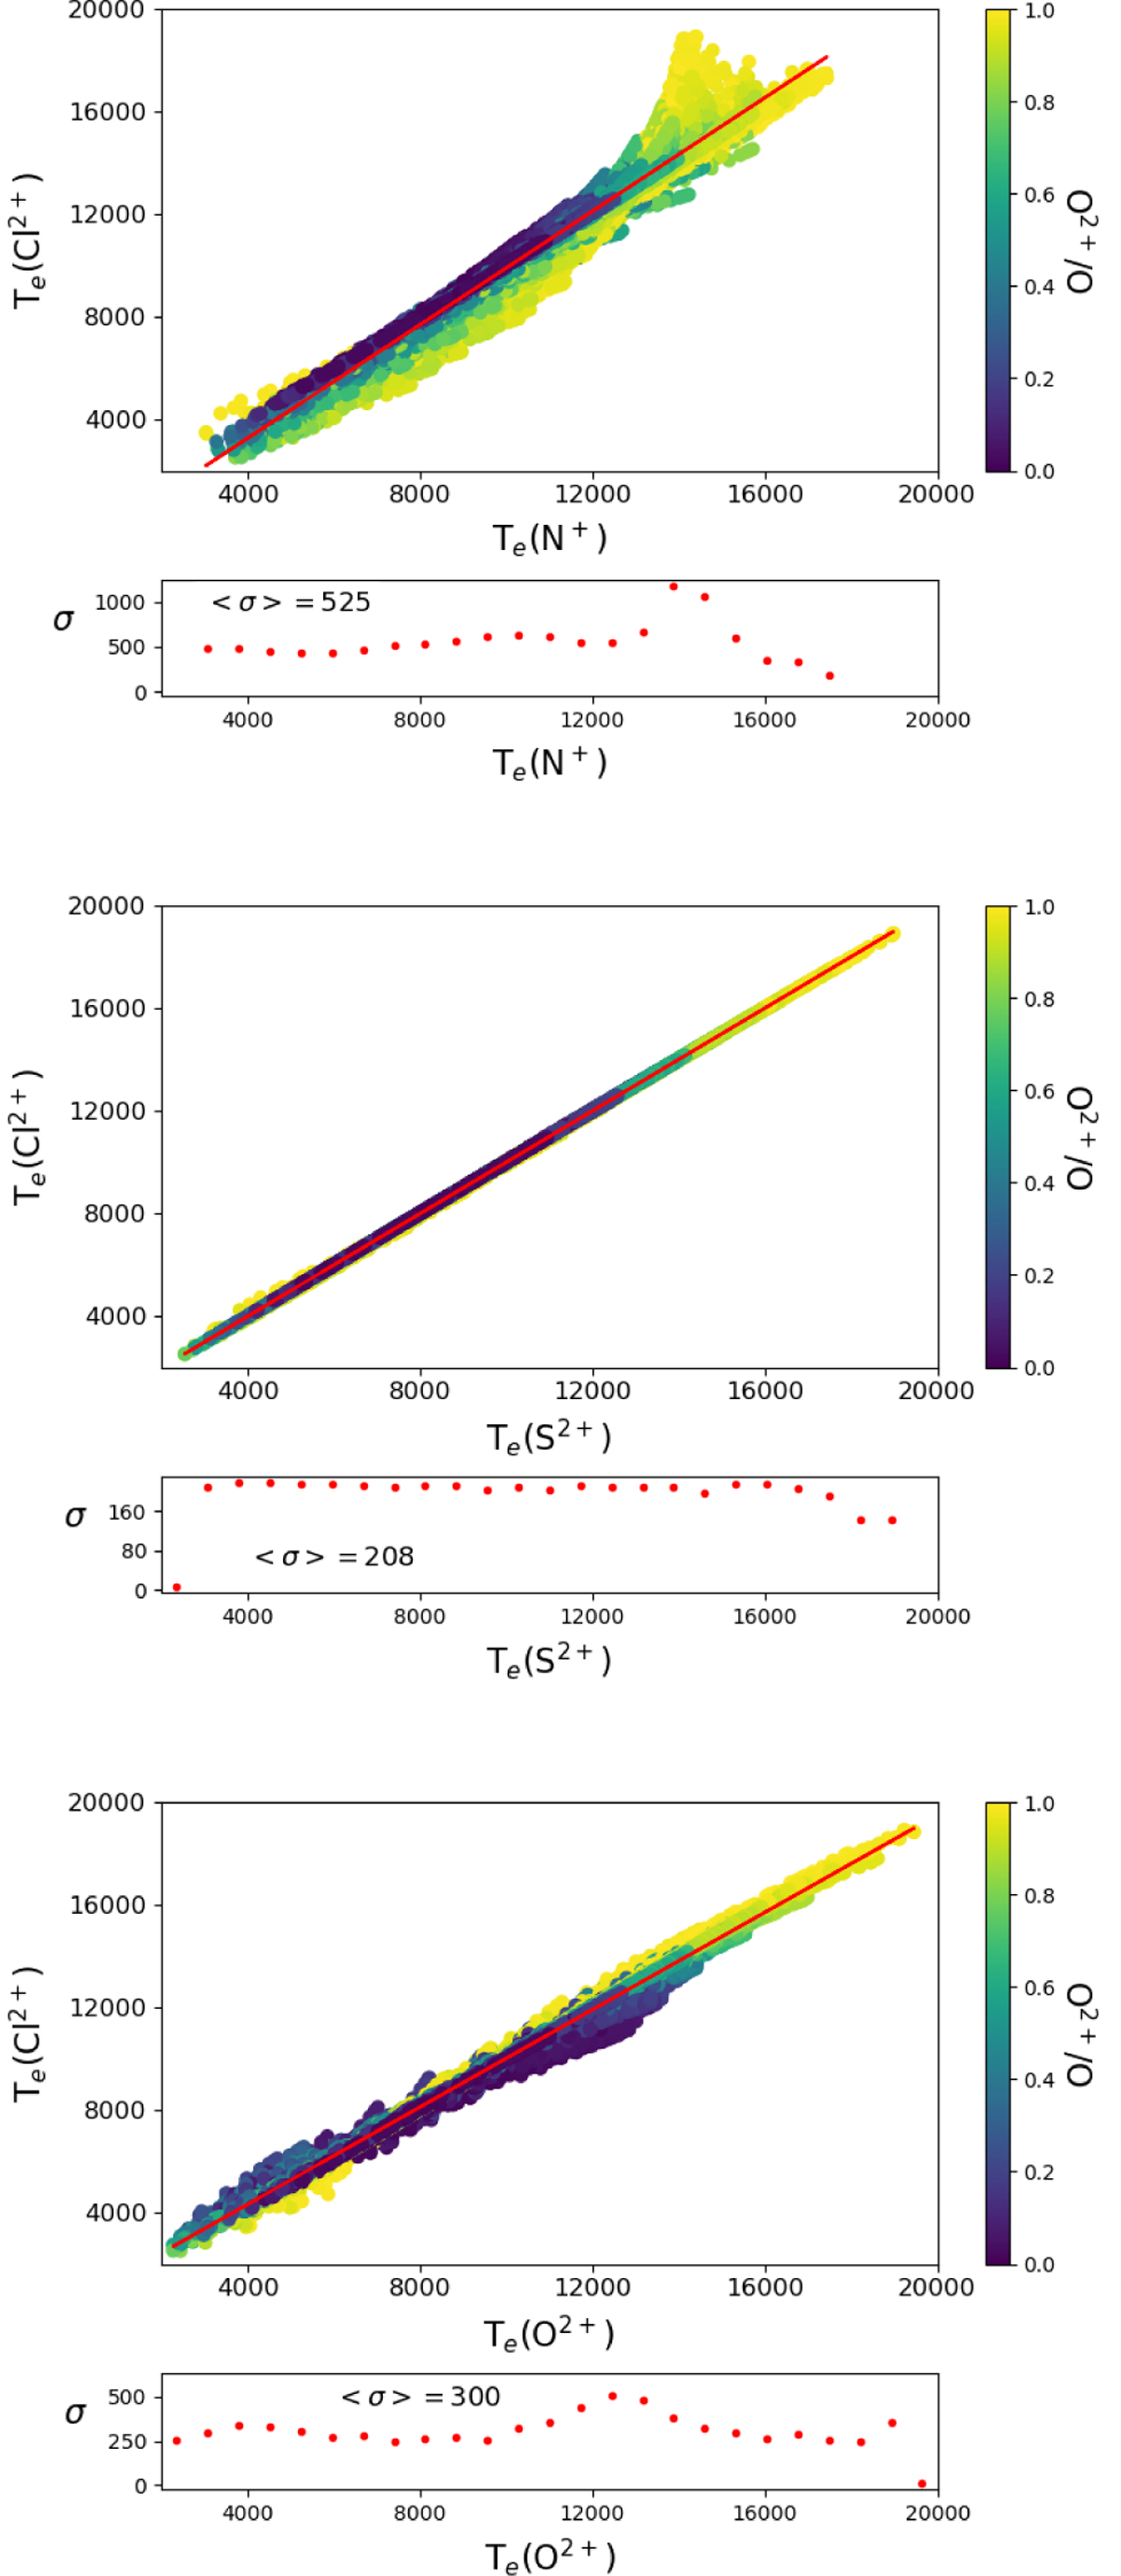
Fig. 3
Download original image
Te(Cl2+) as a function of Te(N+) (top), Te(S2+) (middle), and Te(O2+) (bottom) obtained from the photoionisation models described in the text. Each point represents an individual model colour-coded by its mean ionisation degree, parameterised by the O2+/O ratio. The red line is a linear fit to the points. The small panels represent the values of σ to the fit in 1000 K bins. The mean σ is shown inside the panels.
Current usage metrics show cumulative count of Article Views (full-text article views including HTML views, PDF and ePub downloads, according to the available data) and Abstracts Views on Vision4Press platform.
Data correspond to usage on the plateform after 2015. The current usage metrics is available 48-96 hours after online publication and is updated daily on week days.
Initial download of the metrics may take a while.