Fig. 1
Download original image
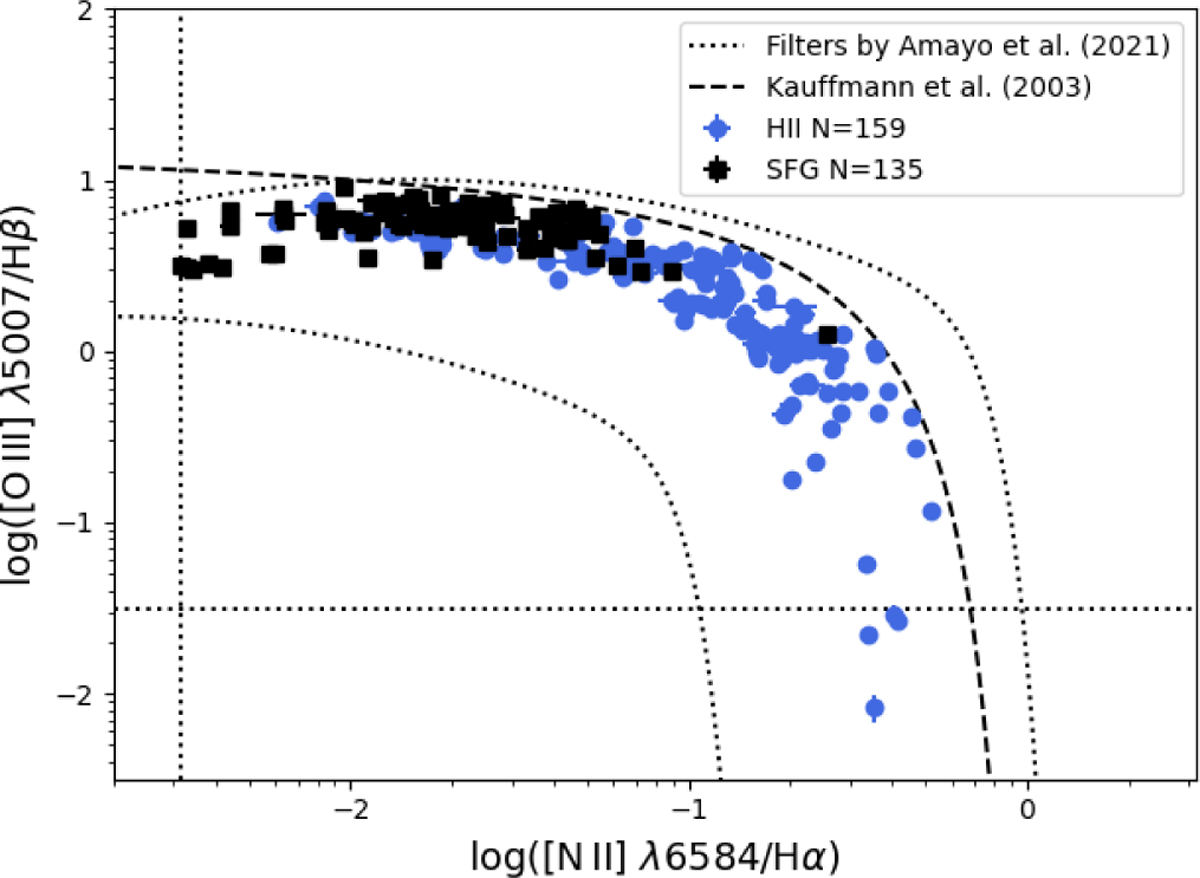
BPT diagram of sample of spectra of Galactic and extragalactic H II regions and star-forming galaxies compiled in DESIRED-E used in this study. The dashed line represents the empirical relation by Kauffmann et al. (2003) that we have used to distinguish between starforming regions and active galactic nuclei (AGNs). The dotted curves and vertical and horizontal lines represent filters applied by Amayo et al. (2021) to extract photoionisation models to construct their ICF scheme for star-forming regions.
Current usage metrics show cumulative count of Article Views (full-text article views including HTML views, PDF and ePub downloads, according to the available data) and Abstracts Views on Vision4Press platform.
Data correspond to usage on the plateform after 2015. The current usage metrics is available 48-96 hours after online publication and is updated daily on week days.
Initial download of the metrics may take a while.