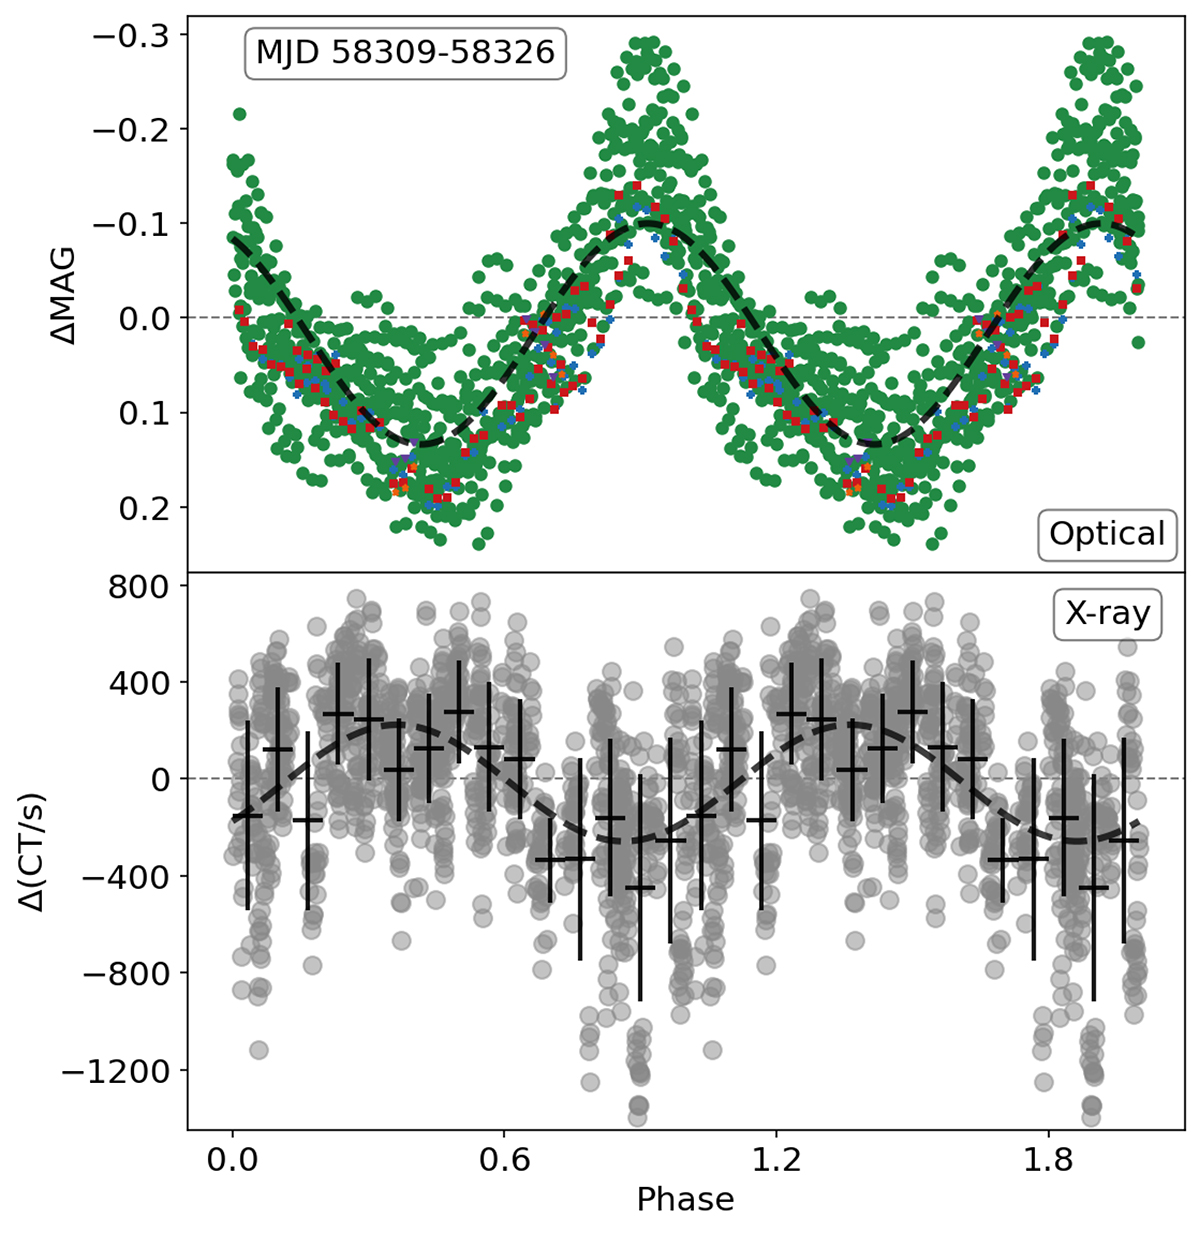
Fig. 9.
Download original image
Comparison of optical and X-ray folded data in the interval MJD 58309-58326 computed using the best-fitting frequency obtained with all optical data between MJD 58283 and MJD 58391 as reported in Table 1. Data are shown together with the best-fitting sinusoid (dashed black lines). The data in the upper panel correspond to the optical data (coloured dots). Lower panel: X-ray data (grey dots) as well as the same data binned in phase (black dots with error bars, 15 bins per phase). The error bars are computed from the standard deviation of the data falling inside every phase bin.
Current usage metrics show cumulative count of Article Views (full-text article views including HTML views, PDF and ePub downloads, according to the available data) and Abstracts Views on Vision4Press platform.
Data correspond to usage on the plateform after 2015. The current usage metrics is available 48-96 hours after online publication and is updated daily on week days.
Initial download of the metrics may take a while.