Fig. 8.
Download original image
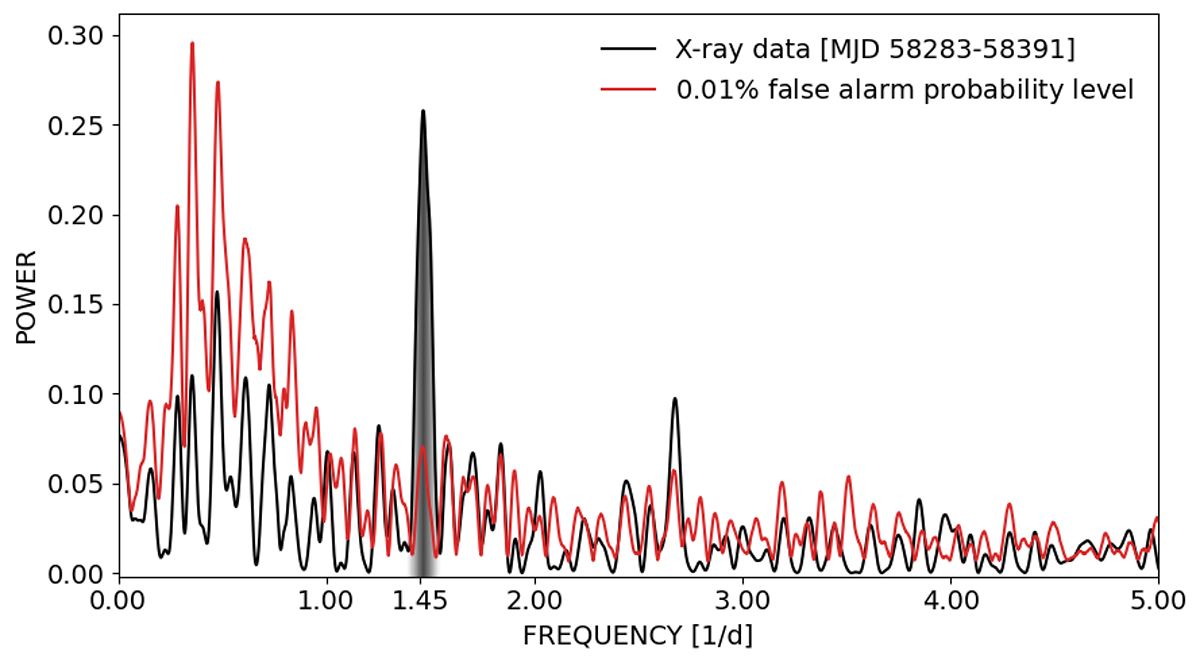
Lomb-Scargle diagram (black curve) computed with the detrended X-ray data in the interval MJD 58309-58326. The red curve correspond to the 0.01% false alarm probability level (see text for details). The highest peak is quite broad, but is centered at the frequency inferred from the optical photometry and well above the false alarm probability level in the range of frequencies around it.
Current usage metrics show cumulative count of Article Views (full-text article views including HTML views, PDF and ePub downloads, according to the available data) and Abstracts Views on Vision4Press platform.
Data correspond to usage on the plateform after 2015. The current usage metrics is available 48-96 hours after online publication and is updated daily on week days.
Initial download of the metrics may take a while.