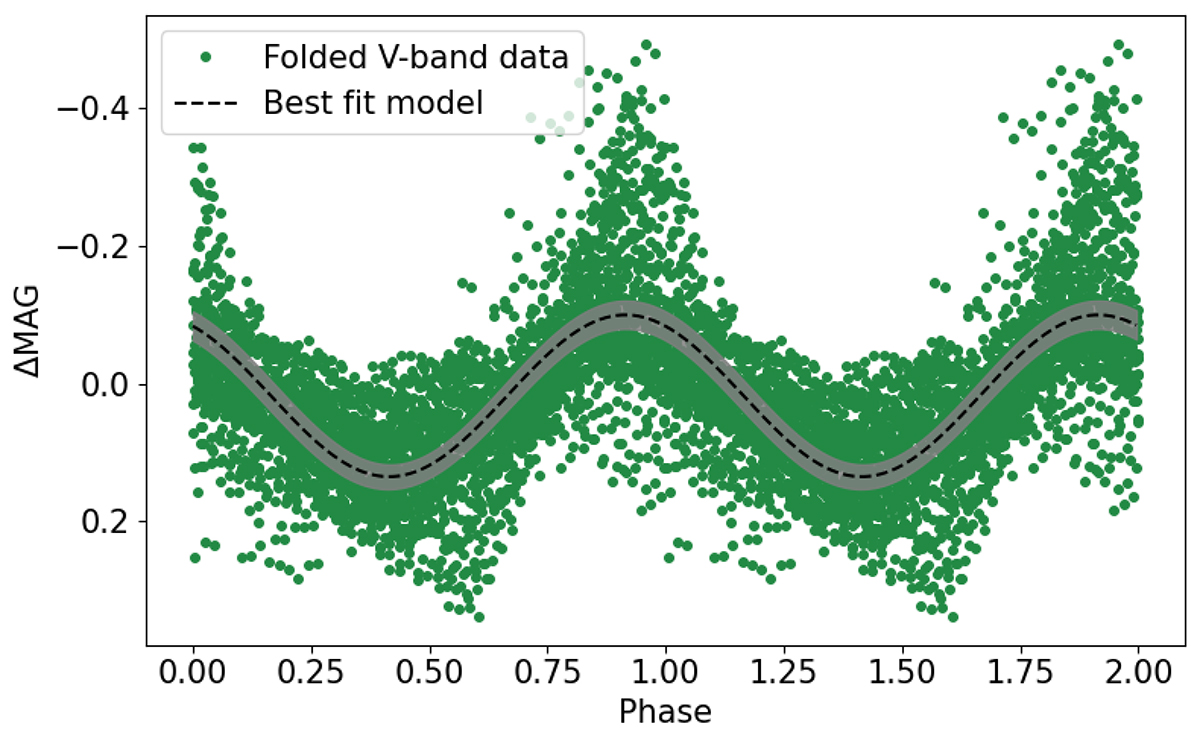
Fig. 6.
Download original image
Data from the V-band between MJD 58283 and MJD 58391 folded with the value of the frequency f reported in Table 1. The dotted black line is the sinusoidal fitted model with the corresponding 3σ confidence uncertainty shown as a grey shaded area. Some residuals can be seen in the plot and are caused by the data within certain time intervals where the oscillation is not perfectly visible or slightly out of phase, as can be seen from Fig. 7.
Current usage metrics show cumulative count of Article Views (full-text article views including HTML views, PDF and ePub downloads, according to the available data) and Abstracts Views on Vision4Press platform.
Data correspond to usage on the plateform after 2015. The current usage metrics is available 48-96 hours after online publication and is updated daily on week days.
Initial download of the metrics may take a while.