Open Access
Fig. 3.
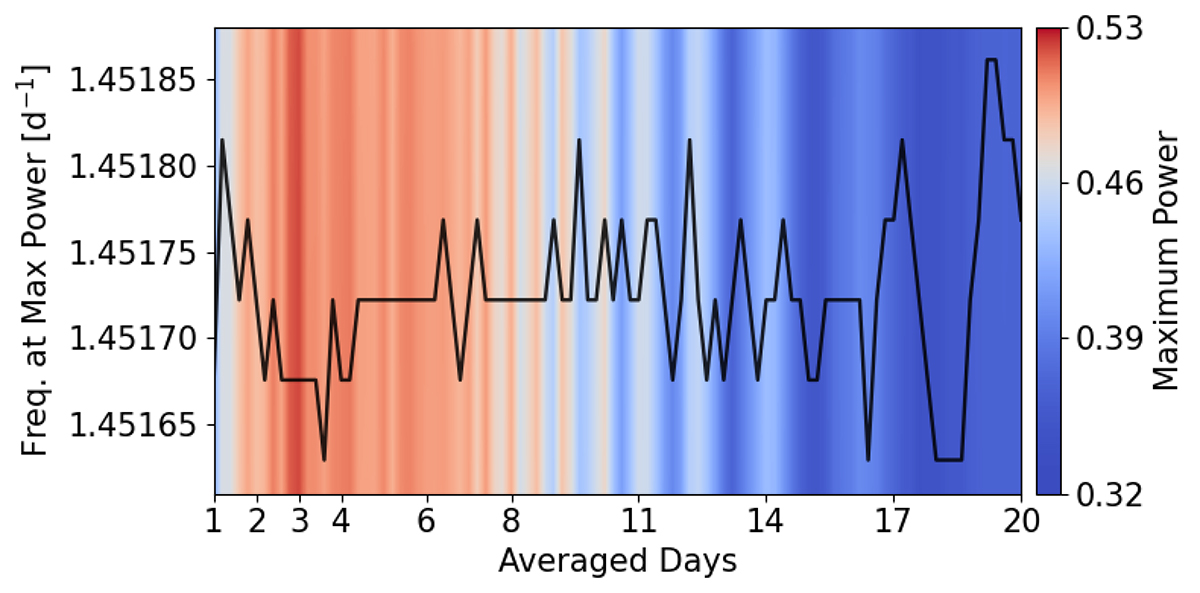
Download original image
Frequency (black line) and power (background colour chart) of the highest peak in the LS diagram computed after detrending the V-band data using the average over N days (x-axis). The maximum power is reached for N = 3 days. The spread of the frequency is compatible with the uncertainties of the measurement.
Current usage metrics show cumulative count of Article Views (full-text article views including HTML views, PDF and ePub downloads, according to the available data) and Abstracts Views on Vision4Press platform.
Data correspond to usage on the plateform after 2015. The current usage metrics is available 48-96 hours after online publication and is updated daily on week days.
Initial download of the metrics may take a while.