Fig. 18.
Download original image
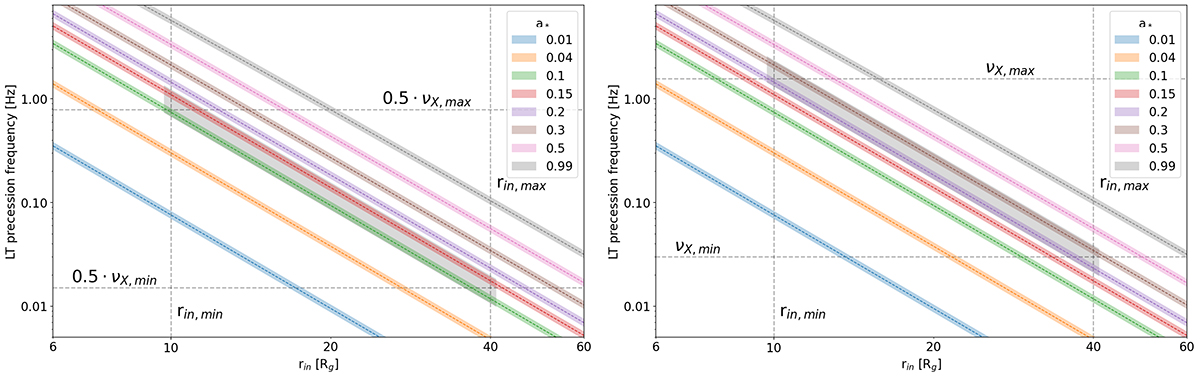
Lense-Thirring precession frequency computed following Eq. (1) in Ingram et al. (2009) and as a function of the truncation radius r_in for different values of the black hole spin a* (coloured lines). The vertical lines correspond to the estimated range of radii for the truncation radius, while the horizontal lines correspond to the minimum and maximum LT precession frequency that we considered. The shaded coloured areas around the lines are the uncertainties from estimated mass of the black hole as reported by Torres et al. (2020), while the grey area represents the parameter space that is in agreement with the data. On the left, we show the solutions that correspond to the scenario in which the fundamental frequency is traced by the QPOs at lower frequencies seen in the optical data. On the right, we show the solutions that correspond to the scenario in which the fundamental frequency is traced by the most prominent peak in the X-rays.
Current usage metrics show cumulative count of Article Views (full-text article views including HTML views, PDF and ePub downloads, according to the available data) and Abstracts Views on Vision4Press platform.
Data correspond to usage on the plateform after 2015. The current usage metrics is available 48-96 hours after online publication and is updated daily on week days.
Initial download of the metrics may take a while.