Fig. 17.
Download original image
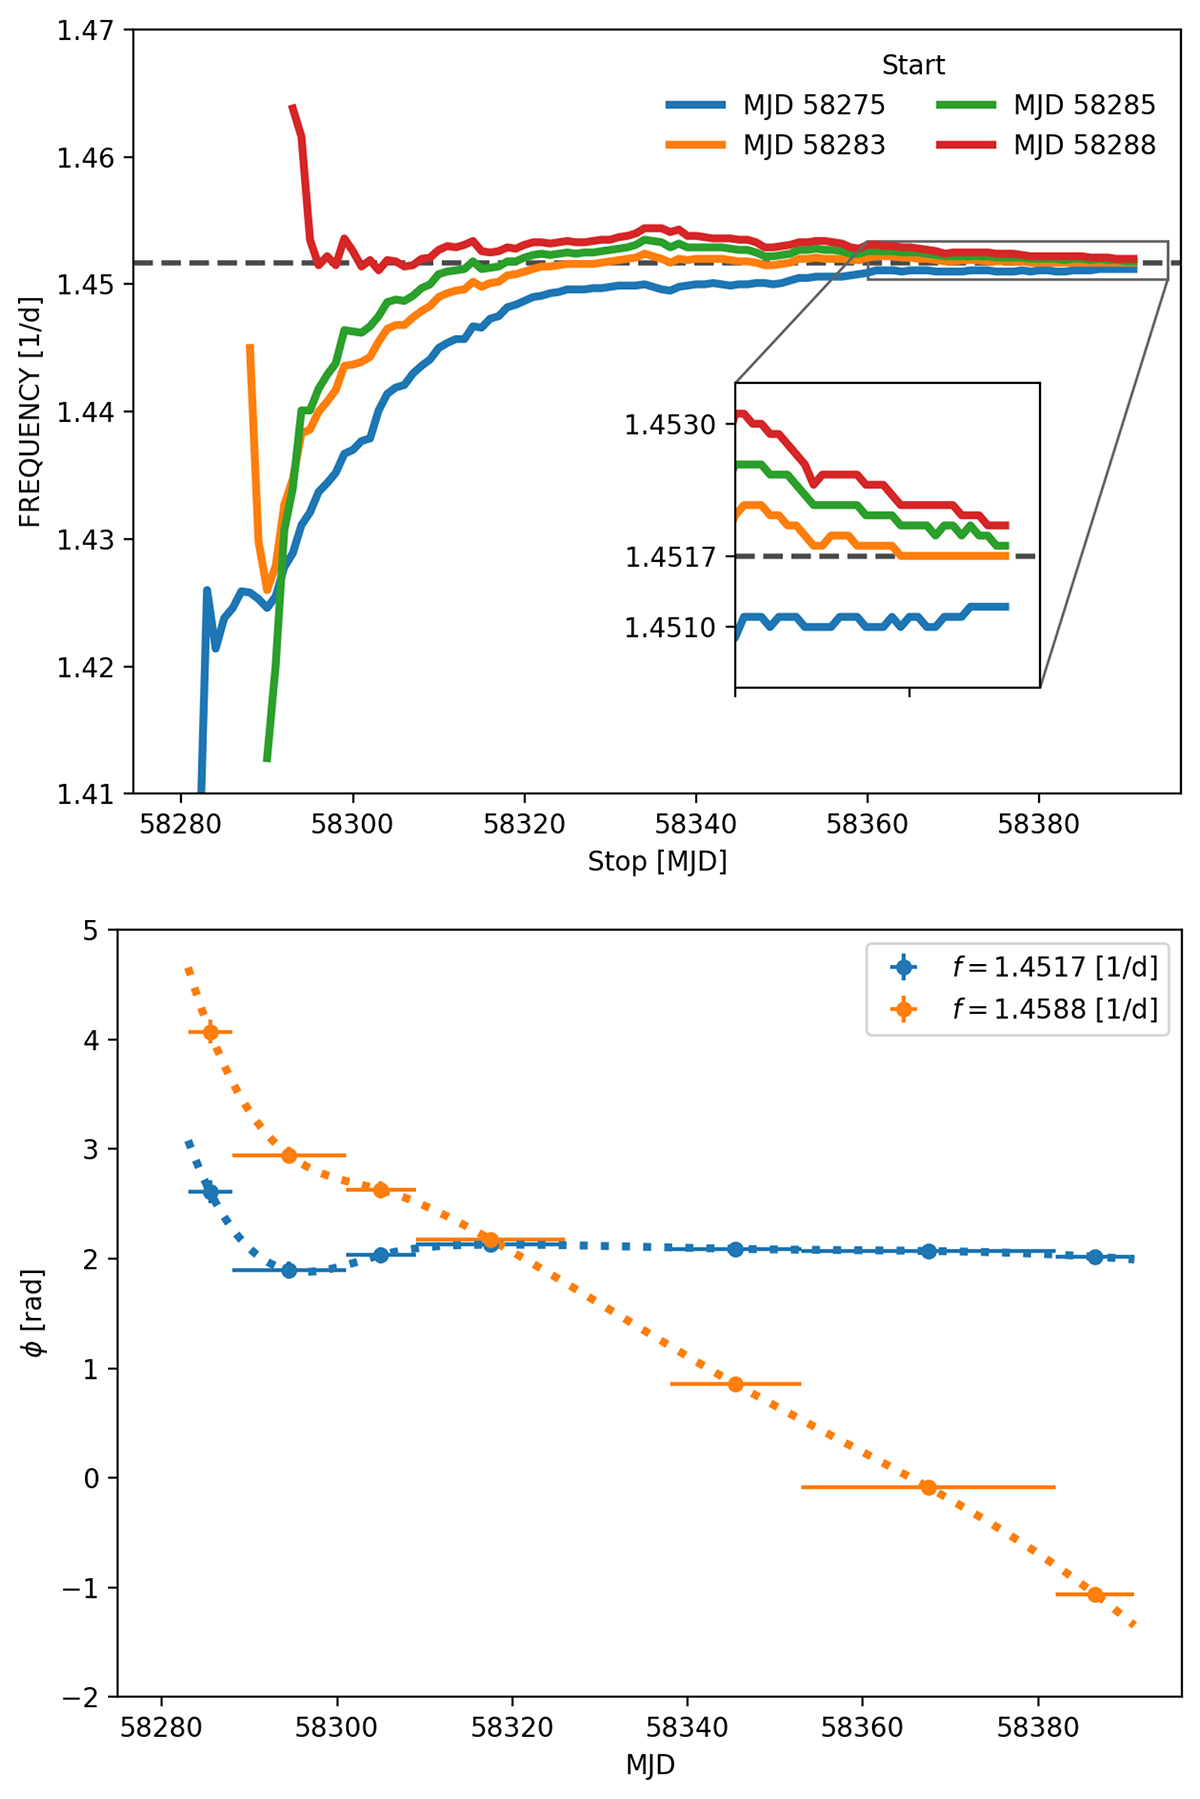
Top: Frequency of the highest peak in the LS diagrams computed considering different starting dates. The x-axis correspond to the stopping date used for computing the LS diagrams. The frequency always quickly evolves to the reference value of ∼1.4517 1/d−1 (dashed black line). In addition, as the starting date is moved forward, the curves tend faster and faster towards the reference value. The curve that deviates most from this trend is the one corresponding to the starting date MJD 58275 (blue curve), which includes data when the modulation was still evolving. Bottom: Phase evolution considering the dates shown in Fig. 7 (excluding the data in MJD 58326-58338) and using two different frequencies. In blue the frequency computed in this work (f58283 − 58391 = 1.4517 1/d) and in orange the frequency related to the orbital motion (forb = 1.4588 1/d, Torres et al. 2019). The dotted lines are cubic splines fitted to the data.
Current usage metrics show cumulative count of Article Views (full-text article views including HTML views, PDF and ePub downloads, according to the available data) and Abstracts Views on Vision4Press platform.
Data correspond to usage on the plateform after 2015. The current usage metrics is available 48-96 hours after online publication and is updated daily on week days.
Initial download of the metrics may take a while.