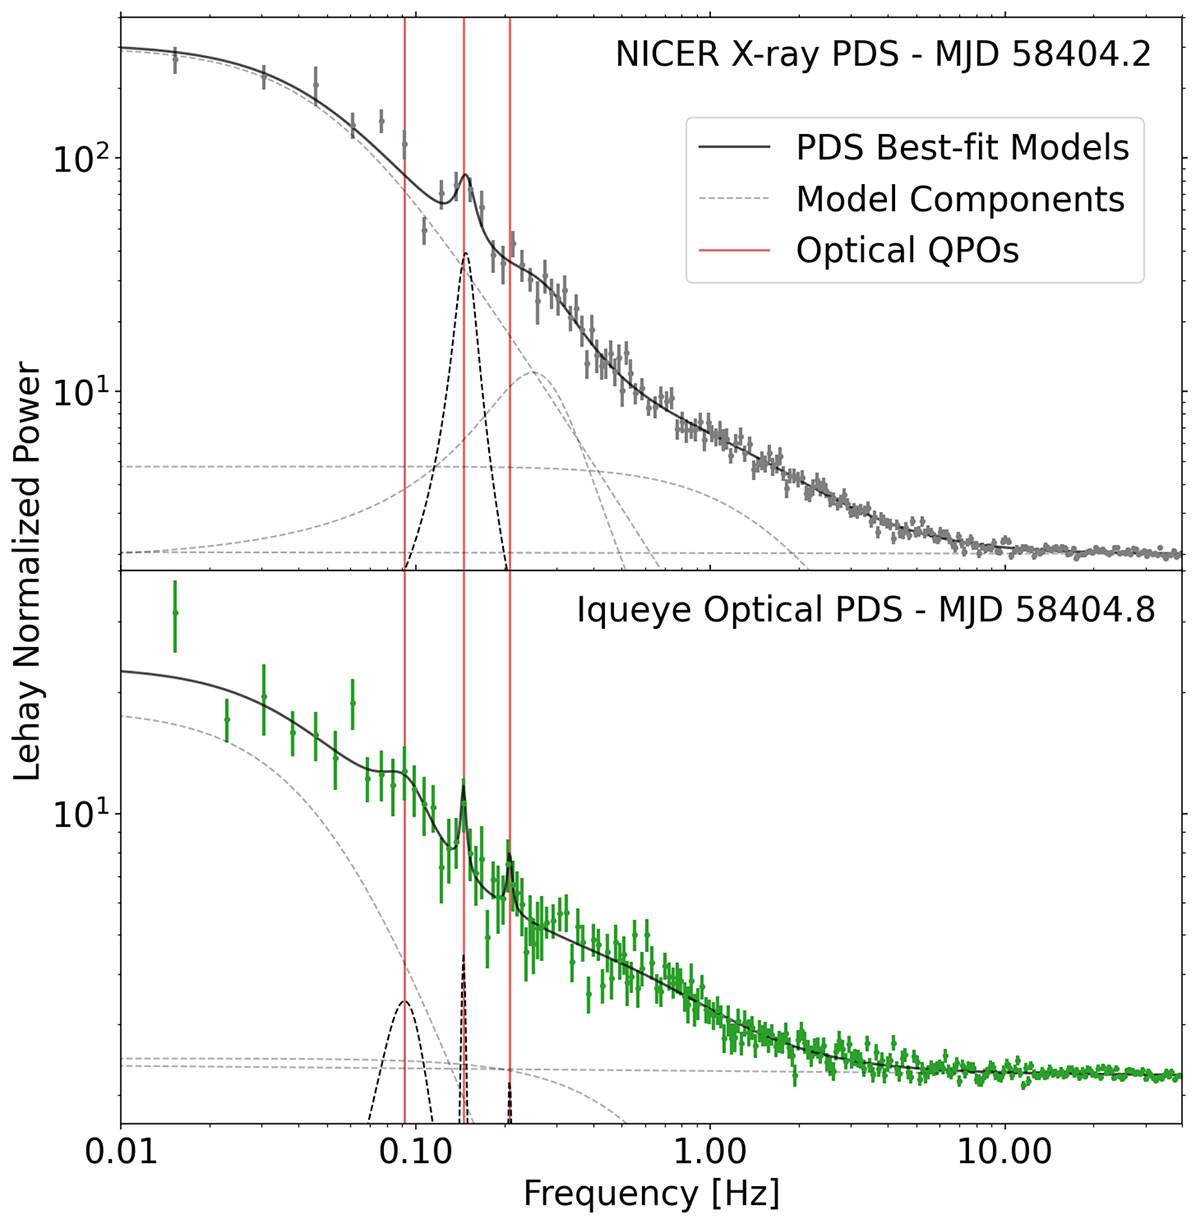
Fig. 16.
Download original image
Comparison of optical and X-ray PDS of MAXIJ1820+070 for the data taken around 13 October 2018. The top panel shows the NICER PDS, and the bottom panel shows the Iqueye PDS. As no overlapping observations are available, we used for comparison the closest X-ray observation to our optical observation. The X-ray observation after our optical observation shows no clear QPO, and therefore we do not show the corresponding PDS. The vertical red lines correspond to the central frequency of the QPOs in the optical PDS. The frequency of the most prominent optical QPO (the second one in the optical PDS) is in good agreement with the frequency of the X-ray QPO.
Current usage metrics show cumulative count of Article Views (full-text article views including HTML views, PDF and ePub downloads, according to the available data) and Abstracts Views on Vision4Press platform.
Data correspond to usage on the plateform after 2015. The current usage metrics is available 48-96 hours after online publication and is updated daily on week days.
Initial download of the metrics may take a while.