Open Access
Fig. 14.
Download original image
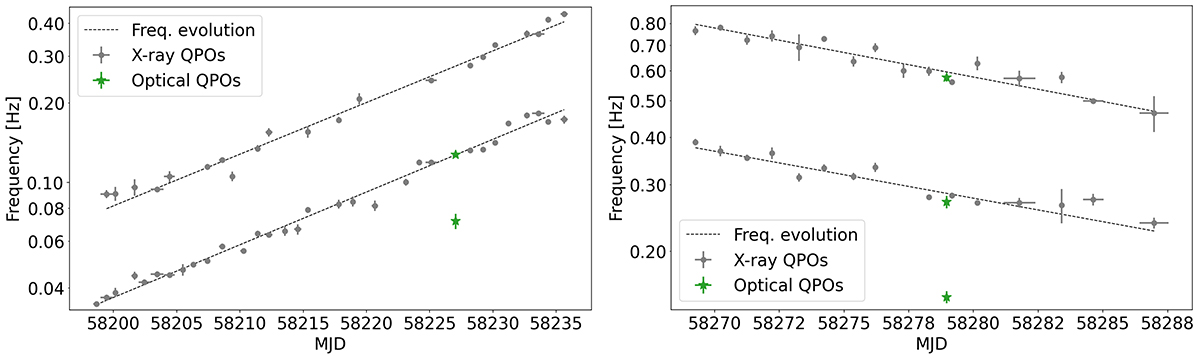
Time evolution of the central frequency of the two most prominent X-ray QPOs in NICER data (grey points) together with the central frequency of the optical QPOs (green stars). On the left we show the evolution during March-April 2018, while on the right is the evolution during June 2018.
Current usage metrics show cumulative count of Article Views (full-text article views including HTML views, PDF and ePub downloads, according to the available data) and Abstracts Views on Vision4Press platform.
Data correspond to usage on the plateform after 2015. The current usage metrics is available 48-96 hours after online publication and is updated daily on week days.
Initial download of the metrics may take a while.