Fig. 13.
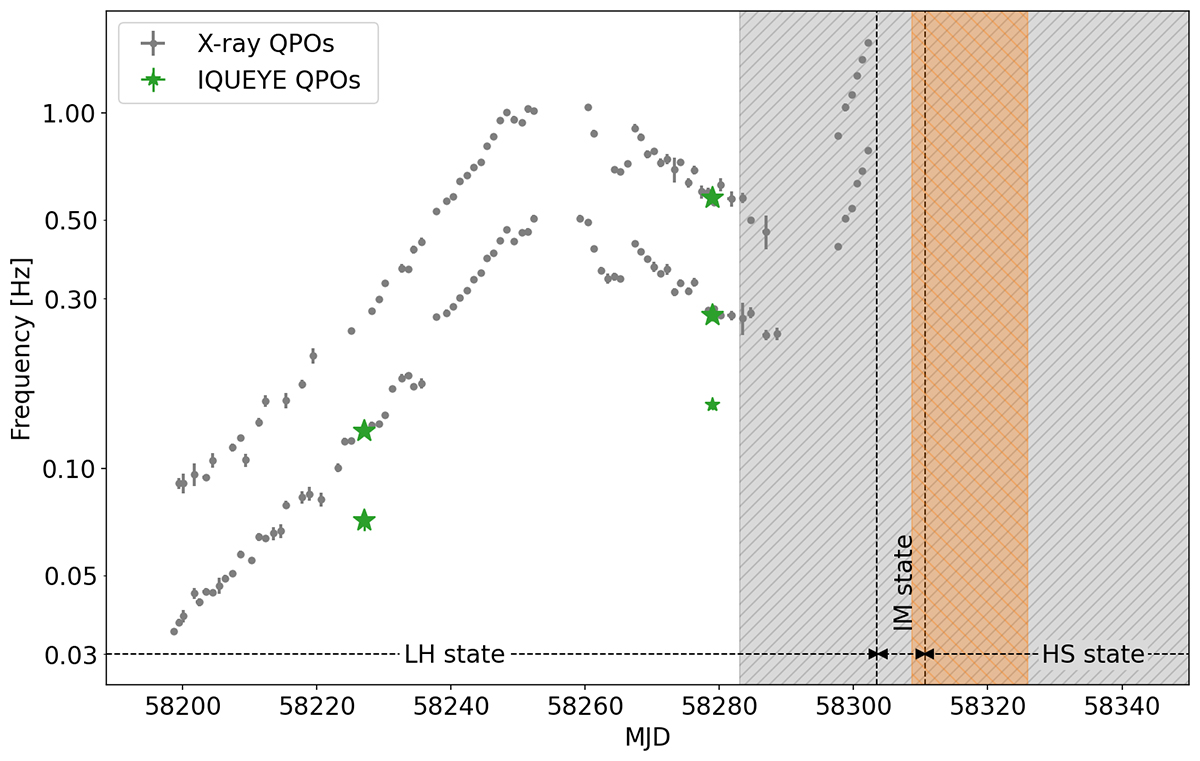
Download original image
Central frequency evolution of NICER QPOs (grey points) compared to the optical QPOs (green stars) and the periods where the optical (grey shaded area) and the X-ray (orange shaded area) modulation can be seen in the light curves. We also show the epochs of the different accretion states that the source entered, as reported by Shidatsu et al. (2019).
Current usage metrics show cumulative count of Article Views (full-text article views including HTML views, PDF and ePub downloads, according to the available data) and Abstracts Views on Vision4Press platform.
Data correspond to usage on the plateform after 2015. The current usage metrics is available 48-96 hours after online publication and is updated daily on week days.
Initial download of the metrics may take a while.