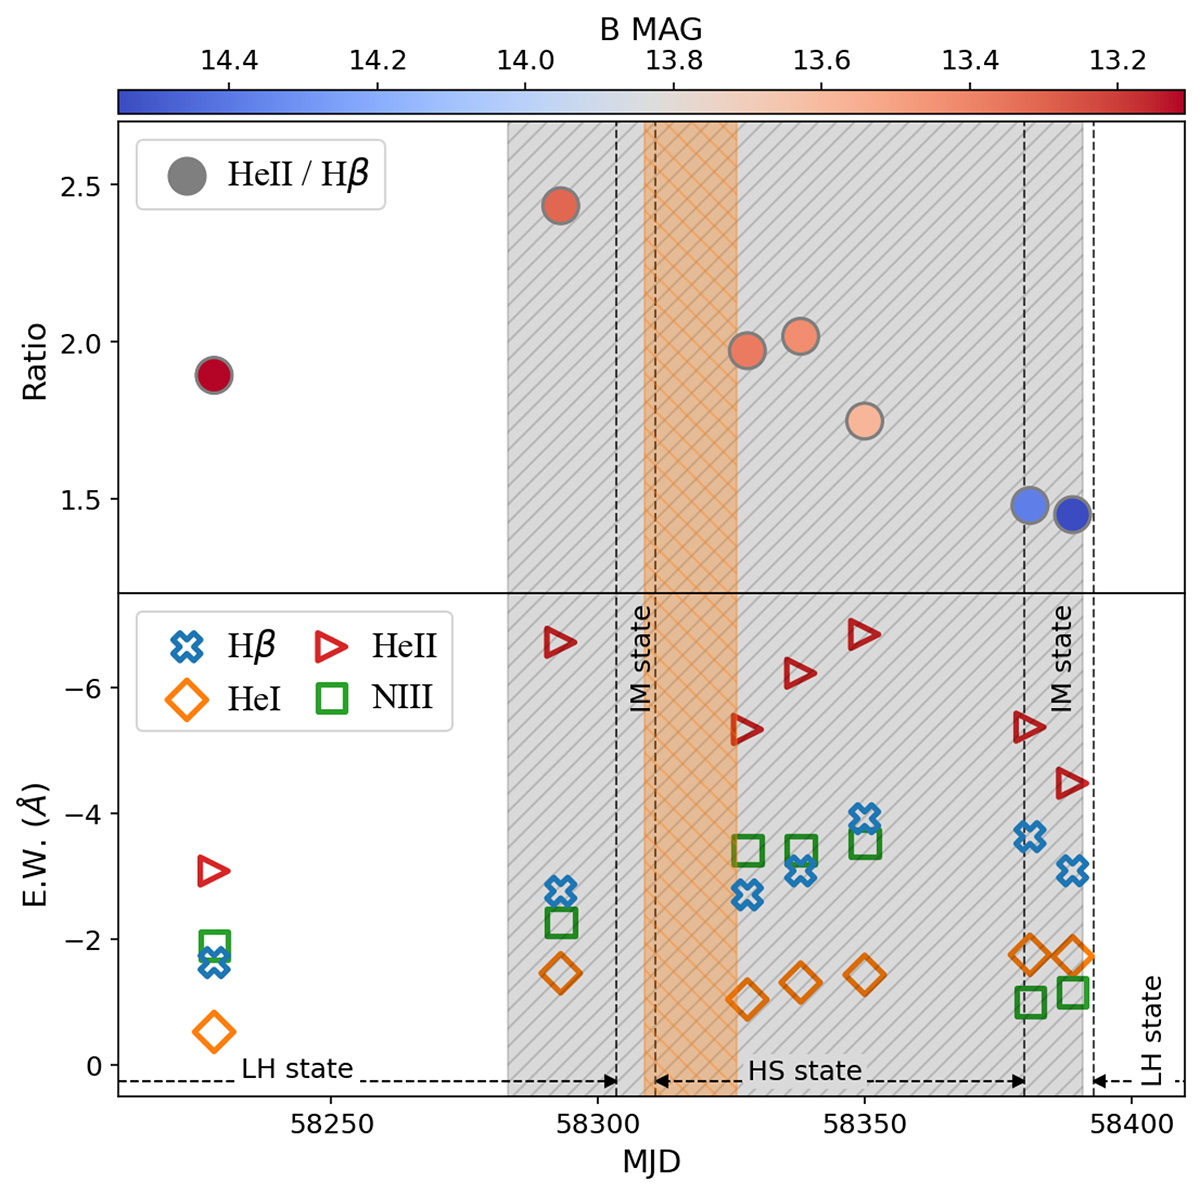
Fig. 12.
Download original image
Bottom panel: Evolution of the equivalent width (in Å) of representative emission lines as a function of time, calculated from the spectra of MAXI J1820+070 in Fig. 11. Top panel: Ratio between the equivalent widths of two of these lines, HeII 4686 Å and Hβ. The colour bar on the top indicates the value of the B band magnitude of the source at the time of the observations. We show for comparison also the periods where the optical (grey shaded area) and the X-ray (orange shaded area) modulation are seen in the light curves, together with the epochs of the different accretion states that the source entered (Shidatsu et al. 2019).
Current usage metrics show cumulative count of Article Views (full-text article views including HTML views, PDF and ePub downloads, according to the available data) and Abstracts Views on Vision4Press platform.
Data correspond to usage on the plateform after 2015. The current usage metrics is available 48-96 hours after online publication and is updated daily on week days.
Initial download of the metrics may take a while.