Open Access
Fig. 11.
Download original image
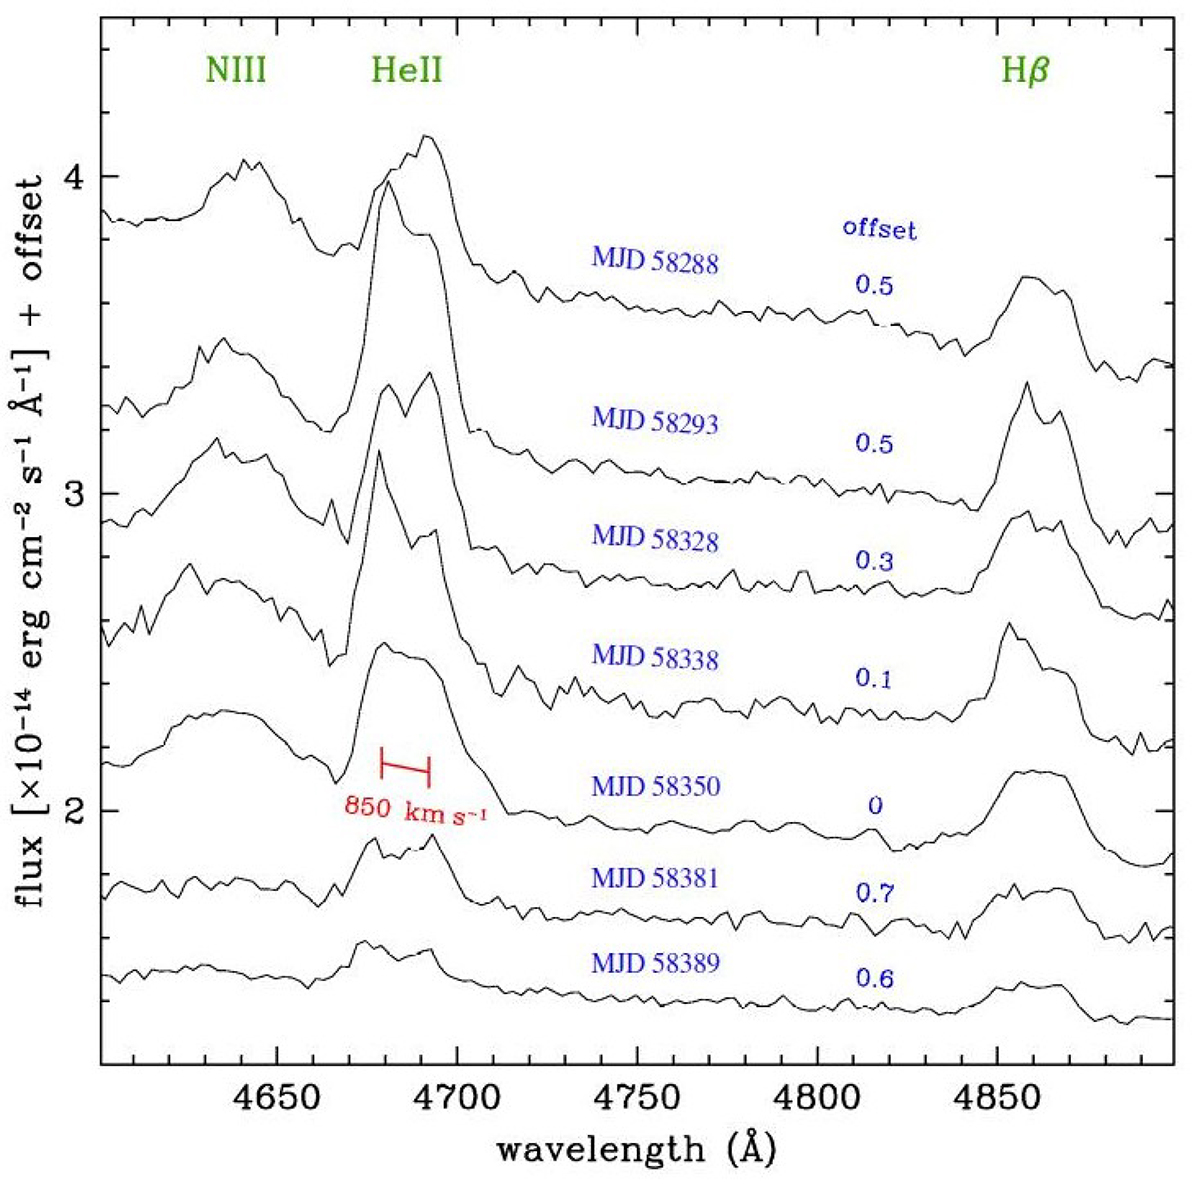
Zoomed-in view from Fig. 10 of the MAXI J1820+070 spectra for 2018 covering hydrogen Hβ, HeII 4686 Å, and the broad 4640 Å blend attributed to NIII lines. The spectra are offset by the indicated quantity for clarity of the plot. The typical velocity separation of 850 km s−1 for the double-peaked profiles is marked.
Current usage metrics show cumulative count of Article Views (full-text article views including HTML views, PDF and ePub downloads, according to the available data) and Abstracts Views on Vision4Press platform.
Data correspond to usage on the plateform after 2015. The current usage metrics is available 48-96 hours after online publication and is updated daily on week days.
Initial download of the metrics may take a while.