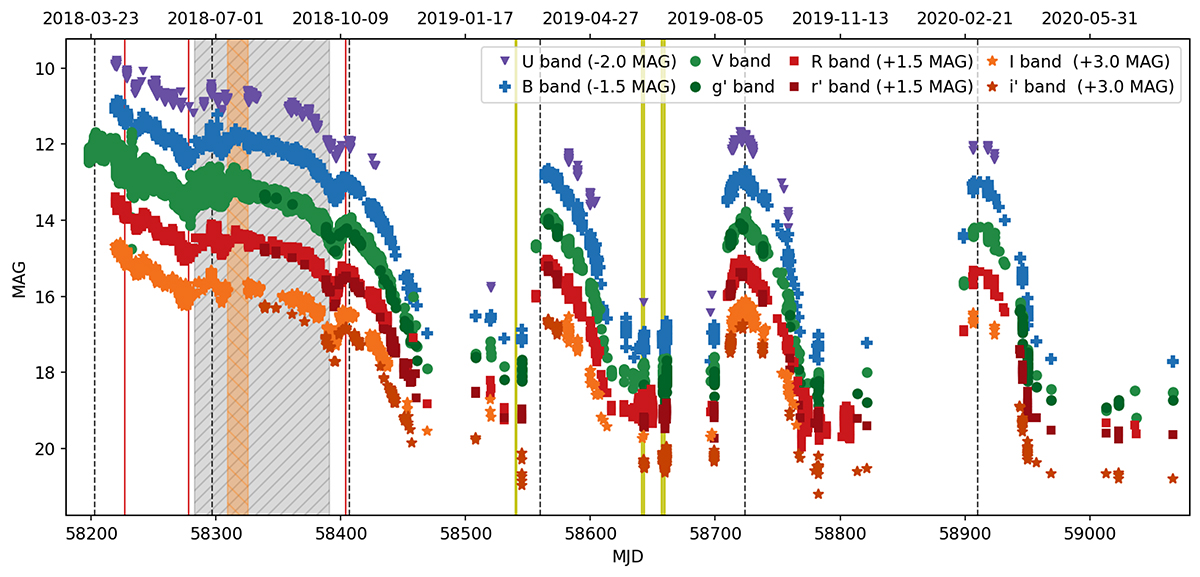
Fig. 1.
Download original image
Light curves of MAXI J1820+070 in different optical bands since the epoch of the first maximum after the discovery of the source and until August 2020. The data taken in the Landolt UBVRI bands (Landolt 1992) are shown in violet, blue, light green, light red, and light orange, respectively. The darker green, red, and orange represents the g′, r′, and i′ Sloan bands of the APASS system (Henden & Munari 2014; Henden et al. 2018). The dashed black vertical lines indicate approximately the dates when the local maximum of the optical luminosity is reached during all the subsequent bursts. The red vertical lines indicate the epochs when we observed optical LFQPOs with Iqueye. The yellow vertical lines indicate the dates when Torres et al. (2019) measured the periodicity of the binary system (1.4591 1/d) spectroscopically. The grey shaded area indicates the interval in which a photometric periodicity is detected in this dataset, while the orange shaded area indicates the interval in which a periodicity can be seen also in the X-ray data.
Current usage metrics show cumulative count of Article Views (full-text article views including HTML views, PDF and ePub downloads, according to the available data) and Abstracts Views on Vision4Press platform.
Data correspond to usage on the plateform after 2015. The current usage metrics is available 48-96 hours after online publication and is updated daily on week days.
Initial download of the metrics may take a while.