Fig. 8.
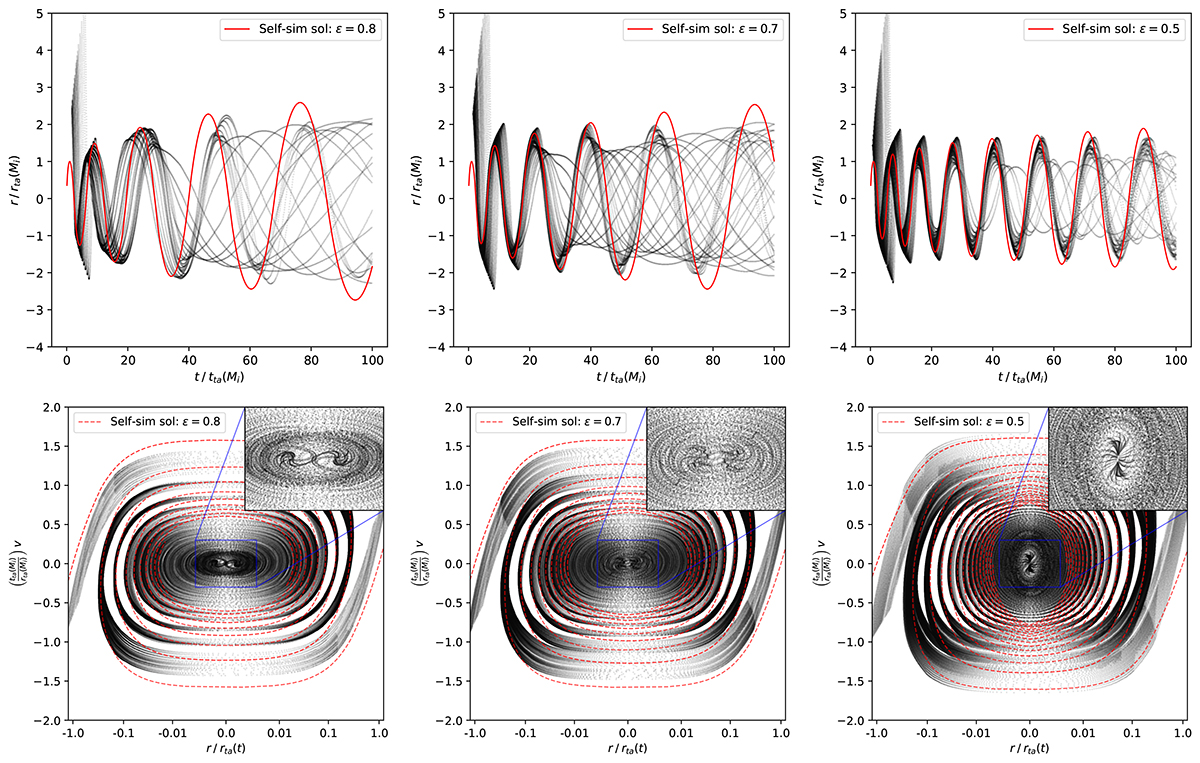
Download original image
Superposition of position-time (top) and phase-space (bottom) trajectories of particles of Lagrangian slices along the x-axis from all the snapshots (where a fit could converge) after being scaled w.r.t. turnaround computed using Equations (8) and (9) using the best fit M0(ϵ) obtained from fitting r−q curves (refer Fig. 4) in Sect. 4.1. Zoomed panels of the central regions in phase space have also been added. Self-similar solutions for ϵ = 0.8, 0.7, 0.5 corresponding to Q1D (left), ANI (middle) and SYM (right) are shown in red.
Current usage metrics show cumulative count of Article Views (full-text article views including HTML views, PDF and ePub downloads, according to the available data) and Abstracts Views on Vision4Press platform.
Data correspond to usage on the plateform after 2015. The current usage metrics is available 48-96 hours after online publication and is updated daily on week days.
Initial download of the metrics may take a while.