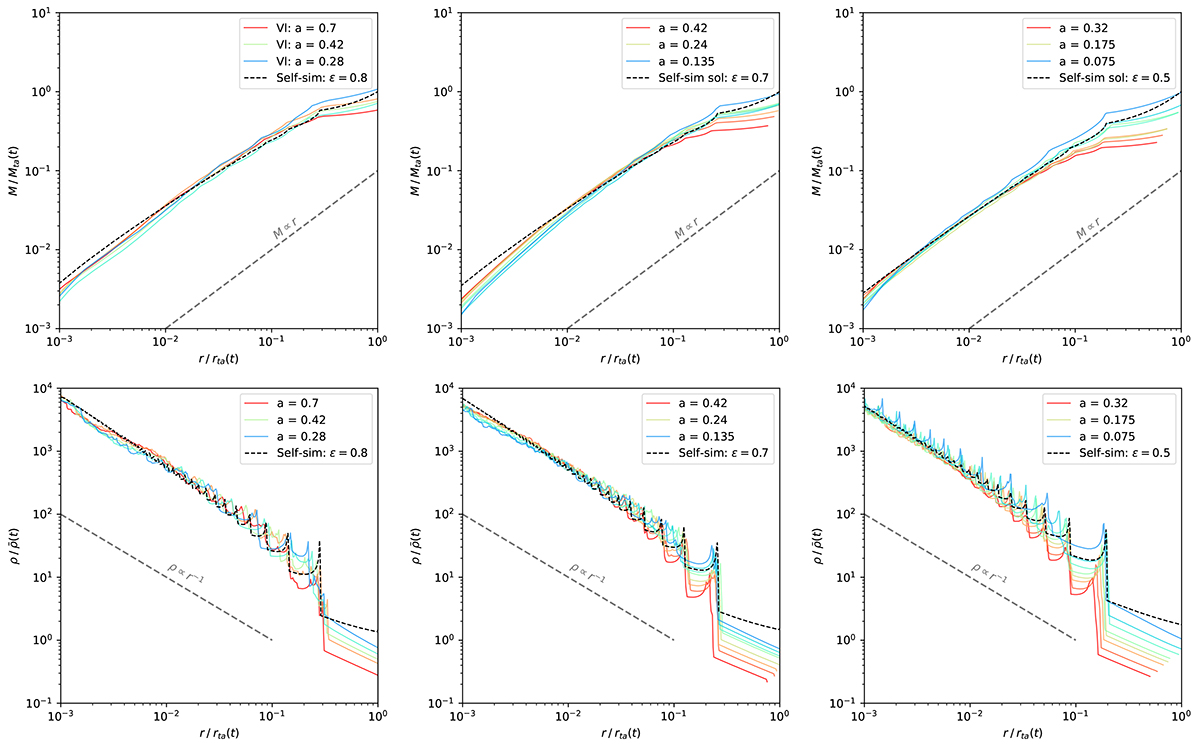
Fig. 7.
Download original image
Mass (top) and density (bottom) profiles from the three simulations: Q1D (left), ANI (middle) and SYM (right) normalized w.r.t. to the mass Mta and radius rta of the turnaround region using the best-fit M0(ϵ) at different snapshots, color coded from blue to red in increasing order of expansion factor. The dashed black curve denotes the self-similar predictions for the mass and density profiles corresponding to ϵ = 0.8, 0.7, 0.5 for Q1D, ANI, and SYM, respectively.
Current usage metrics show cumulative count of Article Views (full-text article views including HTML views, PDF and ePub downloads, according to the available data) and Abstracts Views on Vision4Press platform.
Data correspond to usage on the plateform after 2015. The current usage metrics is available 48-96 hours after online publication and is updated daily on week days.
Initial download of the metrics may take a while.