Fig. 6.
Download original image
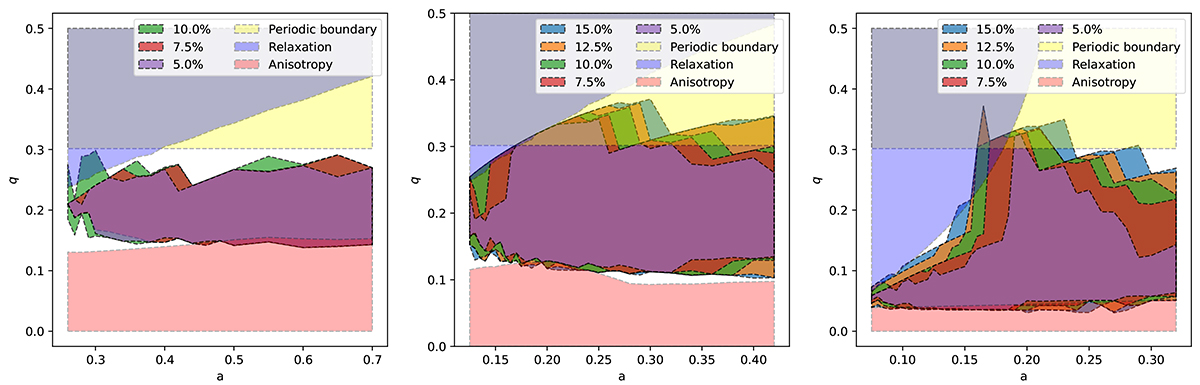
Evolution of bounds in Lagrangian space computed using r−q curves of Lagrangian slices along the x-axis for three cases: Q1D (left), ANI (middle), SYM (right). The parameter ϵ was fixed at 0.8, 0.7, and 0.5, respectively. The multicolored patches labeled with percentages depict the subset of particles in Lagrangian space for which the relative difference in their positions between the data curves and the self-similar fits are within thresholds of 5%, 7.5%, 10%, 12.5%, and 15%. The spaces excluded by bounds arising from relaxation, periodic boundaries, and anisotropy have been shown in blue, yellow, and red patches, respectively.
Current usage metrics show cumulative count of Article Views (full-text article views including HTML views, PDF and ePub downloads, according to the available data) and Abstracts Views on Vision4Press platform.
Data correspond to usage on the plateform after 2015. The current usage metrics is available 48-96 hours after online publication and is updated daily on week days.
Initial download of the metrics may take a while.