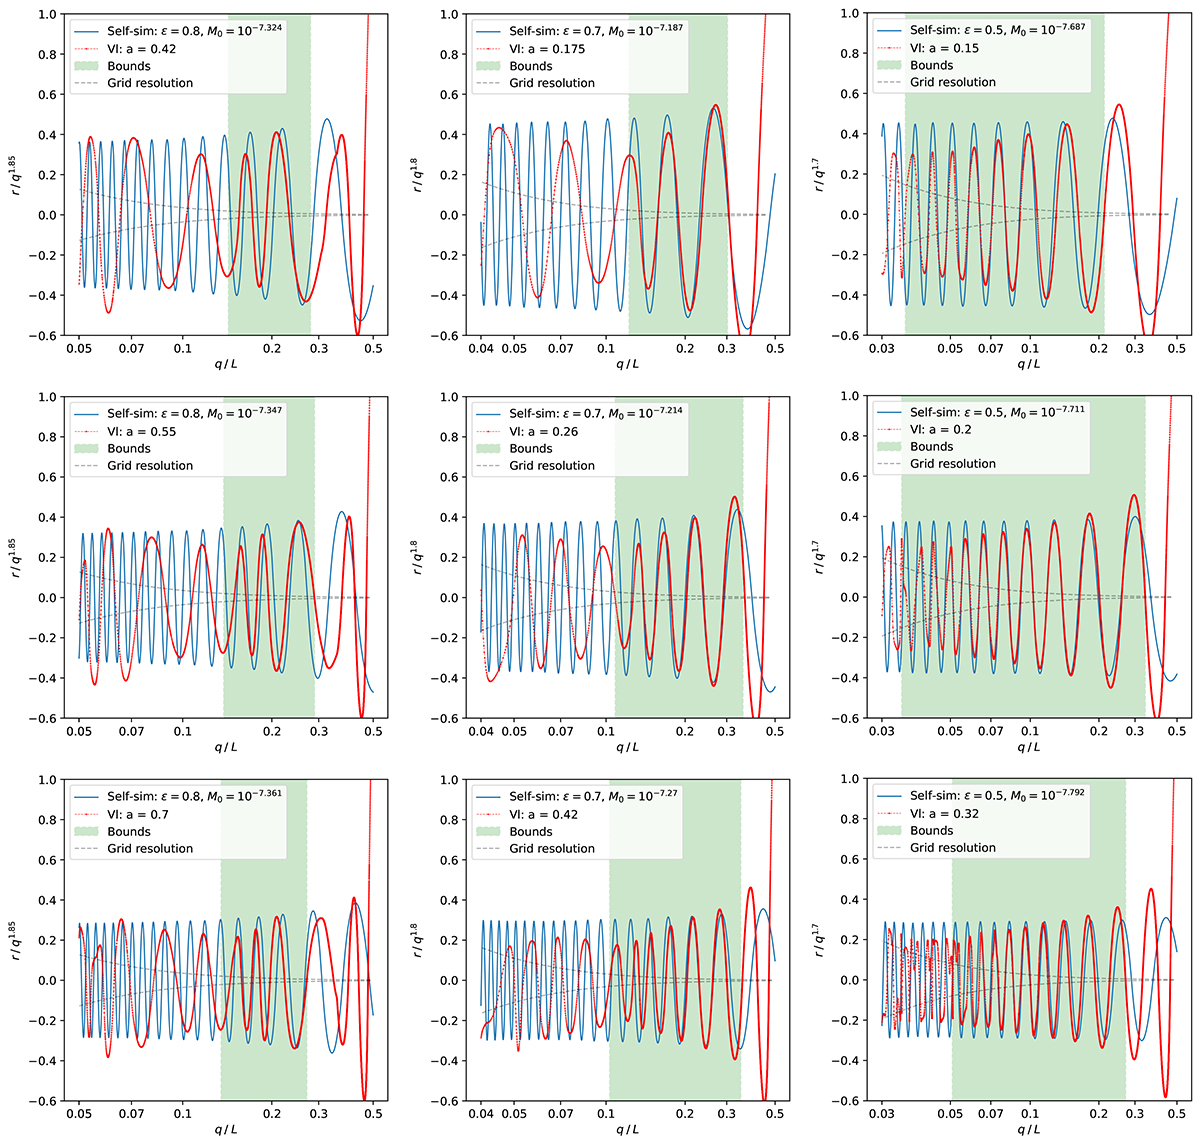
Fig. 4.
Download original image
r−q curves of Lagrangian slices along the x-axis for the three simulations – Q1D (left), ANI (middle), SYM (right) in increasing order of expansion factor from top to bottom. The data points (red, labeled “Vl” as in Vlasov solver used for the simulations) have been cubically interpolated. The self-similar fits (blue) are made using the least-squares method with the parameter ϵ fixed at 0.8, 0.7, and 0.5 for Q1D, ANI, and SYM simulations, respectively. The subsets of particles (green) that follow the self-similar fits were computed assuming a threshold: Δr/rdata≤10%. The axes have been scaled to make the features at lower values of q more prominent. The spatial resolution, ∼0.0005 comoving box units, is shown using dashed black curves.
Current usage metrics show cumulative count of Article Views (full-text article views including HTML views, PDF and ePub downloads, according to the available data) and Abstracts Views on Vision4Press platform.
Data correspond to usage on the plateform after 2015. The current usage metrics is available 48-96 hours after online publication and is updated daily on week days.
Initial download of the metrics may take a while.