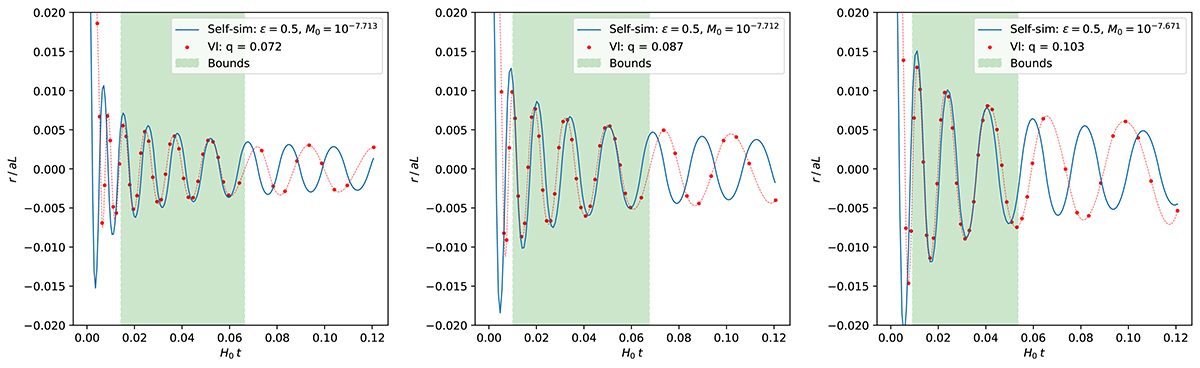
Fig. 3.
Download original image
Position-time trajectories of three Lagrangian points along the x-axis: q/L = 0.072, 0.087, 0.103 (left to right) in the SYM simulation. The data points (red, labeled “Vl” as in Vlasov solver used for the simulations) have been cubically interpolated. The self-similar fits, made using the least-squares method with ϵ = 0.5, are shown in blue. The time intervals (green) within which the trajectories follow the fits were computed assuming a threshold: Δr/rdata≤10%. The spatial resolution of the tessellation grid is ∼0.0005 comoving box units.
Current usage metrics show cumulative count of Article Views (full-text article views including HTML views, PDF and ePub downloads, according to the available data) and Abstracts Views on Vision4Press platform.
Data correspond to usage on the plateform after 2015. The current usage metrics is available 48-96 hours after online publication and is updated daily on week days.
Initial download of the metrics may take a while.