Fig. 1.
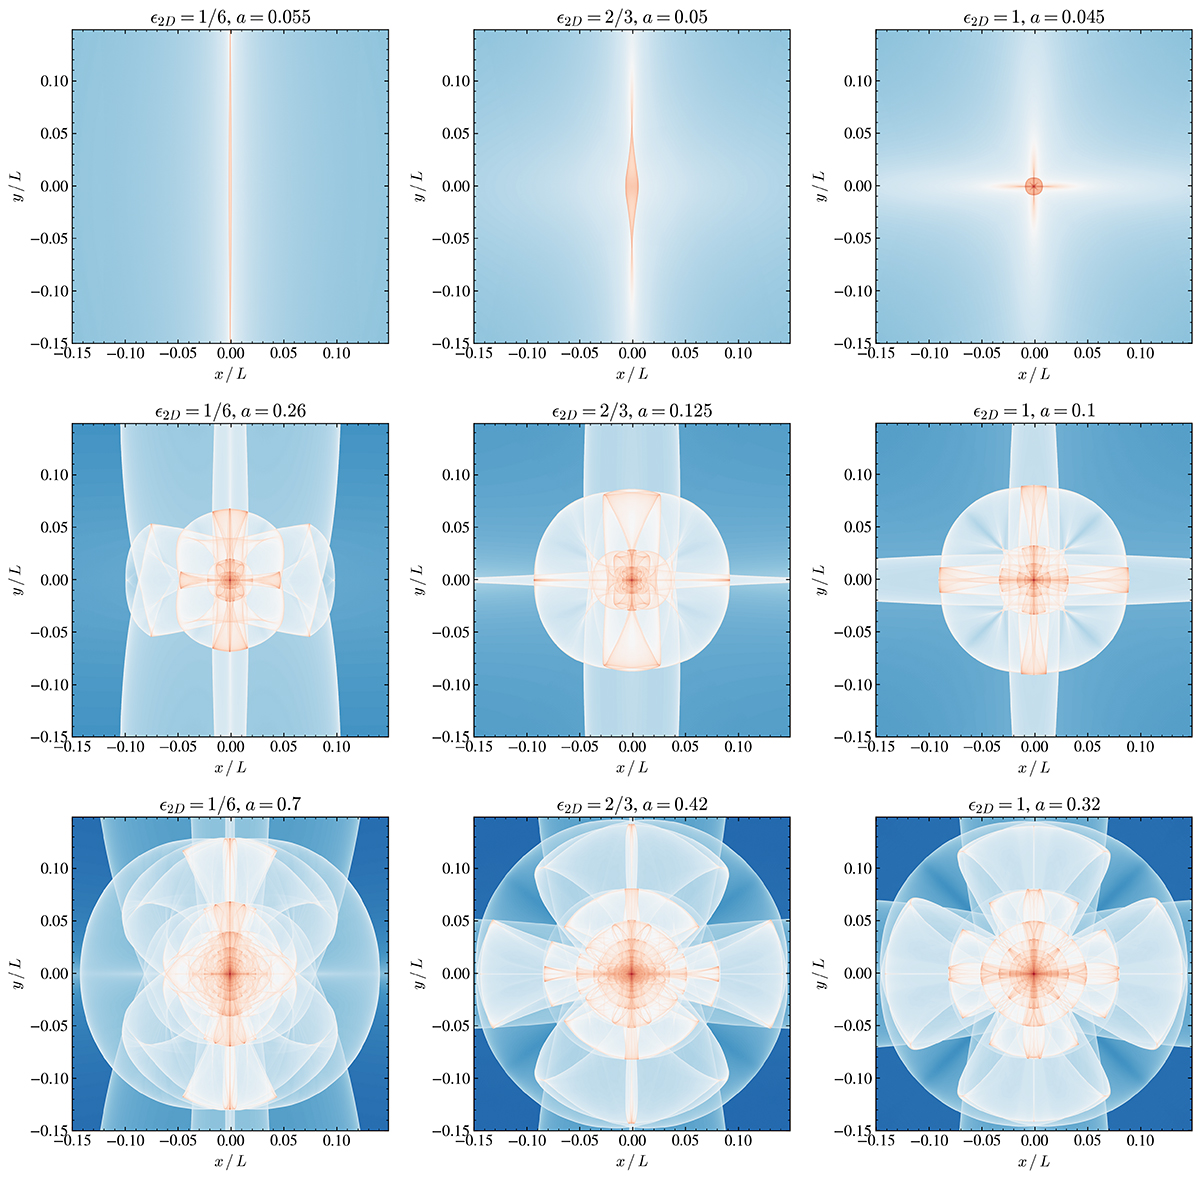
Download original image
Density color maps of our numerically simulated halos. In the left column, we have Q1D simulation snapshots for the expansion factors a = 0.055, 0.26, 0.7. In the middle, we have ANI simulation snapshots for a = 0.05, 0.125, 0.42. In the right column, we have SYM simulation snapshots for a = 0.045, 0.1, 0.32. The top row consists of the closest available snapshots after the first shell crossing in each of the simulations and the bottom row consists of the last available snapshots.
Current usage metrics show cumulative count of Article Views (full-text article views including HTML views, PDF and ePub downloads, according to the available data) and Abstracts Views on Vision4Press platform.
Data correspond to usage on the plateform after 2015. The current usage metrics is available 48-96 hours after online publication and is updated daily on week days.
Initial download of the metrics may take a while.