| Issue |
A&A
Volume 697, May 2025
|
|
|---|---|---|
| Article Number | A75 | |
| Number of page(s) | 9 | |
| Section | Stellar structure and evolution | |
| DOI | https://doi.org/10.1051/0004-6361/202453574 | |
| Published online | 07 May 2025 | |
A Sequoia stellar candidate with very high 7Li and 9Be
1
Universidad Andres Bello, Facultad de Ciencias Exactas, Departamento de Física y Astronomía – Instituto de Astrofísica, Autopista Concepción-Talcahuano, 7100 Talcahuano, Chile
2
INAF-OATs, Via G.B. Tiepolo 11, Trieste I 34143, Italy
3
LIRA, Observatoire de Paris, Université PSL, Sorbonne Université, Université Paris Cité, CY Cergy Paris Université, CNRS, 92190 Meudon, France
4
Institute of Fundamental Physics of the Universe, IFPU, Via Beirut, 2, Trieste I-34151, Italy
5
Dipartimento di Fisica, Università degli Studi di Trieste, via Tiepolo 11, I-34143 Trieste, Italy
6
INFN, Sezione di Trieste, Via A. Valerio 2, 34127 Trieste, Italy
⋆ Corresponding author: This email address is being protected from spambots. You need JavaScript enabled to view it.
Received:
20
December
2024
Accepted:
8
March
2025
Abstract
Aims. The metal-poor star BPM 3066 belongs to the retrograde halo and presents unexpectedly strong spectral features of lithium. To gain insight into the origin of this peculiar abundance, we investigate the chemistry and kinematic properties of this star.
Methods. We performed a local thermodynamic equilibrium chemical abundance analysis of UVES/VLT high-resolution spectra of BPM 3066 using ATLAS9 and ATLAS12 model atmospheres and the MyGIsFOS code. We further characterised the orbital properties of the star by integrating its orbit and analysing its integrals of motion using the galpy code.
Results. The star BPM 3066 shows an exceptional overabundance of both lithium and beryllium. The abundances are A(Li) = 3.0 and A(Be) = 2.1, which are respectively about 0.8 and 2.2 dex higher than the Li and Be abundances expected at [Fe/H] = −1.5, the metallicity of the star. The observed ratio 7Li/9Be is 7.9, which is close to that expected from a synthesis by spallation processes. Overabundances of Si, Al, and of the neutron capture elements Sr,Y, Zr, and Ba are also measured. Kinematically, BPM 3066 has an eccentric, strongly retrograde orbit, confined to a height lower than 1 kpc from the galactic plane, and it is a candidate member of the Sequoia/Thamnos accreted galaxy.
Conclusions. The processes leading to the 7Li and 9Be synthesis could have occurred in the environment of a hypernova. This is supported by some abundance anomalies like the high value of Si, [Si/Fe] = 1.2 and [Si/O] = 1.1. However, the simultaneous high values of N, Na, Al, Sc, Ti, and Cu are at odds with the expectations from a hypernova. Alternatively, the abundances of BPM 3066 could result from the engulfing of rocky planets that were rich in spallated Li and Be. In both cases, it is remarkable that such an extreme abundance pattern has been found in a star belonging to the Sequoia/Thamnos accreted galaxy.
Key words: nuclear reactions / nucleosynthesis / abundances / stars: abundances / planetary systems / stars: Population II / Galaxy: stellar content / Galaxy: structure
© The Authors 2025
 Open Access article, published by EDP Sciences, under the terms of the Creative Commons Attribution License (https://creativecommons.org/licenses/by/4.0), which permits unrestricted use, distribution, and reproduction in any medium, provided the original work is properly cited.
This article is published in open access under the Subscribe to Open model. This email address is being protected from spambots. You need JavaScript enabled to view it. to support open access publication.
1. Introduction
The origin of the light elements lithium and beryllium is different from that of the other elements that are burnt and synthesised in the hot interior of stars. Li has multiple origins as it is made in the Big Bang, in the interstellar medium (ISM) by spallation, in asymptotic giant branch stars (AGBs), and in novae (Molaro 2023). On the other hand, 9Be is a pure product of spallation processes of CNO nuclei by energetic cosmic rays or of energetic CNO nuclei onto protons and α particles at rest in the ISM (Reeves et al. 1970).
Unevolved halo stars show a flat plateau in the A(Li) versus [Fe/H] plane, the so-called Spite plateau (Spite & Spite 1982, A(Li) = 2.2), which bears witness to the primordial production of lithium, even though the Li abundances observed in old, unevolved metal-poor stars are significantly smaller than expected from primordial nucleosynthesis when the baryon-to-photon density is estimated by the primordial deuterium abundance (Coc & Vangioni 2017, A(Li) = 2.72).
In contrast to Li, no significant 9Be (the only stable Be isotope) production is expected in standard big bang nucleosynthesis, and a steady, roughly linear increase in the 9Be abundance with metallicity is observed, which suggests that Be behaves like a primary element (Molaro et al. 1997; Smiljanic et al. 2009; Boesgaard et al. 2011), and that there is an enrichment mechanism acting on a galactic scale. Several authors have investigated a possible flattening of this relation at the lowest metallicities, which might indicate the presence of a plateau pointing to a primordial component suggested by inhomogeneous cosmologies (Malaney & Fowler 1989; Primas et al. 2000; Smiljanic et al. 2021). There is an intrinsic scatter in the Be-Fe relation that could be attributed to the contribution of the different galactic sub-components that were assembled at early epochs (Smiljanic et al. 2021), since the cosmic ray flux and CNO abundances could have been different between galaxies, and a different growth rate could be possible. Molaro et al. (2020) show that the [Be/H] versus [Fe/H] relation of candidate stars of Gaia-Sausage-Enceladus (Belokurov et al. 2018; Haywood et al. 2018; Helmi et al. 2018, GSE, the latest major accretion event in the Milky Way) is less scattered and has a different gradient in comparison to the Milky Way.
We report here on the detection of a metal-poor, lithium-rich dwarf star that simultaneously, presents an exceptionally large Be abundance and an overall peculiar chemical composition. We discuss the possible origin of this star and its peculiarities.
The paper is organised as follows: in Sect. 2, we report on the observations. In Sect. 3 we describe the chemical abundance analysis, and in Sect. 4 we provide a kinematic characterisation of the star. We note that the star turns out to be a candidate Sequoia (or Thamnos) star (Barbá et al. 2019; Myeong et al. 2019; Villanova et al. 2019; Koppelman et al. 2019), another of the Galactic halo sub-structures detected in the Gaia era. In Sect. 5 we discuss our results, including the possible origin of the observed chemical patterns. Finally, we summarise our findings in Sect. 6.
2. Target and observations
Star BPM 3066 was first listed in the Bruce Proper Motion Survey as possessing an appreciable proper motion1. The survey was carried out in the 1930s by Willem Luyten using the 24-inch Harvard Observatory Bruce Telescope after it had been moved to South Africa and preliminary photometric colours had been measured for the star (Luyten & Dartayet 1942). The star was later observed as part of the GALactic Archaeology with HERMES (GALAH) survey (Buder et al. 2021) and Simpson et al. (2021) identified the star as a lithium-rich dwarf belonging to the retrograde halo (see Sect. 4).
The Gaia G magnitude of BPM 3066 is 12.78. Observations of BPM 3066, also known as Gaia DR3 4667364088963367808, GALAH 131116000501386, and 2MASS J03355522-6833454, have been obtained with the Ultraviolet and Visual Echelle Spectrograph (UVES, Dekker et al. 2000) at the European Southern Observatory Very Large Telescope (ESO-VLT) under program 111.24HT.001, P.I L. Monaco. A single 593-second exposure was acquired at airmass 1.5 on the night between the 17 and the 18 July, 2023. We adopted the DIC1 346+580 UVES setting, which covers the 304.4–391.7 nm and 472.6–683.5 nm spectral ranges with the blue and red arm, respectively. We further adopted two by two on chip binning (50 kHz readout speed, high gain). The blue arm spectrum includes the 9BeII λλ 313.0422, 313.1067 nm resonance doublet, while the red arm covers the Li resonance doublet at 670.78 nm. We adopted a slit width of 1.2″ in the blue arm and 1.0″ in the red arm, which deliver a spectral resolving power of 37 000 and 42 000, respectively. We retrieved the reduced data2 from the ESO archive3.
The signal-to-noise (S/N) ratio is ≃100 at 671 nm and ≃15 at 313 nm, respectively. The stellar radial velocity has been measured using the red arm spectrum through a cross-correlation function (Tonry & Davis 1979) with a synthetic spectrum calculated with atmospheric parameters similar to that of the star using the fxcor task within IRAF v2.184 (Tody 1986, 1993; Fitzpatrick et al. 2024). From the UVES spectra, we obtained a radial velocity of 263.16 ± 0.13 km s−1, which is in agreement with the value of 263.02 ± 2.53 of Gaia and the 264.04 ± 0.25 km s−1 of GALAH, indicating that BPM 3066 is not a radial velocity variable.
3. Chemical abundance analysis
The stellar atmospheric parameters were obtained with the iterative procedure described in Lombardo et al. (2021, see also Bonifacio et al. 2024). Briefly, we adopted the reddening of the star from the Schlafly & Finkbeiner (2011) maps. The de-reddened Gaia GBP − GRP colour was compared with synthetic photometry in order to derive the stellar effective temperature, Teff, and the bolometric correction. Then, the surface gravity, log g, was obtained from the Stefan-Boltzmann equation. Finally, the extinction coefficients were updated and the whole procedure was iterated until convergence (ΔTeff < 50 K and Δlog g < 0.05 dex). The synthetic colours were computed from the Mucciarelli et al. (in prep.) grid of ATLAS9 fluxes.
We used the parameters obtained in this way to derive the stellar metallicity using the MyGIsFOS code (Sbordone et al. 2014) and, with this new metallicity, we repeated the procedure once more to obtain the final stellar parameters. The microturbulence was derived using the Mashonkina et al. (2017) calibration. The grid of synthetic spectra employed were the same described in Lombardo et al. (2023) and were computed with SYNTHE (Kurucz 2005) using a grid of ATLAS 12 (Kurucz 2005) model atmospheres (Sbordone, in prep.). We performed an additional run to derive the chemical abundances using the MyGIsFOS code with the final stellar parameters. The abundances obtained were used to compute an ATLAS12 model atmosphere (Kurucz 2005), which was used to compute a dedicated grid of synthetic spectra in which the model atmosphere is always the same and all abundances are scaled, at steps of 0.2 dex between −1 and +1 with respect to those of the starting model. The synthetic spectra in this case were computed with turbospectrum (Alvarez & Plez 1998; Plez 2012). This non-standard use of MyGIsFOS has the advantage of circumventing the issue with ionised elements highlighted by Bonifacio et al. (2024), as demonstrated in Caffau et al. (2024). From a MyGIsFOS run with this dedicated grid, we obtained the final chemical abundances, which are reported in Table 1.
Local thermodynamic equilibrium abundances of BPM 3066.
For BPM 3066, we adopted Teff = 5910 K, log g = 4.29 dex, and ξ = 1.15 km s−1. The iron metallicity obtained from 196 neutral iron lines is [Fe/H] = −1.57 dex, while the value from 20 singly ionised iron lines is [Fe/H] = −1.52 dex.
The GALAH survey adopted very similar parameters (Teff = 5874 K, log g = 4.29 dex, and ξ = 1.19 km s−1), but obtained a metallicity about 0.2 dex larger ([Fe/H] = −1.33 dex, Buder et al. 2021). The GALAH collaboration only provides non-local thermodynamic equilibrium (NLTE) abundances, thus their abundances are not directly comparable to ours. For Fe, NLTE corrections are based on the computations of Amarsi et al. (2016), who adopt the theory by Barklem (2016) to describe the collisions with H atoms. Our estimate of the NLTE correction for this star is +0.04 dex (Bergemann et al. 2012), which is based on the assumption that the collision with neutral hydrogen can be represented by the ‘Drawin’ formalism (Drawin 1968, 1969; Steenbock & Holweger 1984), assuming SH = 1, and provides NLTE corrections that are systematically smaller than those of Amarsi et al. (2016). For example, for star HD 140283, Amarsi et al. (2016) provide an Fe abundance that is 0.1 dex higher than that of Bergemann et al. (2012). Thus, at least 0.14 dex of the difference between our Fe and that of GALAH can be ascribed to the NLTE corrections adopted by GALAH; the rest of the difference is well within the error of either result. For BPM 3066 the Gaia DR3 astrophysical parameters catalogue (Gaia Collaboration 2023) reports photometric temperatures, surface gravities, and metallicities of teff_gspphot = 6082 K, logg_gspphot = 4.35 dex, and mh_gspphot = −1.43, which are in remarkably good agreement with ours.
In Fig. 1, we show the position of BPM 3066 (filled star) in the absolute optical UCAC4 V versus (B − V) (left panel Zacharias et al. 2013) and Gaia G versus (GBP − GRP) (middle panel) colour-magnitude diagrams (CMDs). The right panel shows the position of BPM 3066 in the Kiel diagram. The orange star is for the Teff, log g parameters we adopt, while the blue one is for the parameters estimated by the BSTEP code (‘Bayesian Stellar Parameter Estimation’, Sharma et al. 2018) as reported in the corresponding GALAH DR3 value-added catalogue, namely Teff = 6031 K, log g = 4.3. These values were obtained by combining a set of observables with PARSEC isochrones (‘PAdova and TRieste Stellar Evolution Code’, Bressan et al. 2012). In all panels, we also plot two PARSEC isochrones of metallicity and age (Gyr) ([M/H], Age) = (−0.71, 11.7) (blue isochrone) and (−1.26, 13.0) (orange isochrone). The former are GALAH DR3 BSTEP values. The latter is the global metallicity we obtained from the Salaris & Cassisi (2005) formula, using the iron abundance we measured and an α enhancement of [α/Fe] = +0.4. We also adopted a reference age of 13 Gyr.
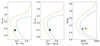 |
Fig. 1. Left and middle panels: V vs. (B − V) and Gaia G vs. (GBP − GRP) colour-magnitude diagrams (CMDs). Right panel: Kiel diagram, log g vs. Teff. Star BPM 3066 is indicated by the filled star. In the right panel, the orange star is for the parameters we adopt here, while the blue one is for the GALAH BSTEP parameters. In all panels, two PARSEC isochrones of metallicity and ages ([M/H], Age) = (−0.71, 11.7) and (−1.26, 13.0) are shown in blue and orange, respectively. |
The position of BPM 3066 in all diagrams clearly indicates that the star is currently on the main sequence, even though the orange isochrone does not provide a perfect fit to BPM 3066, particularly in the Kiel diagram, where some ambiguity between the main sequence and sub-giant branch remains. A gravity 0.45 (0.23) smaller (larger) would be required for the stars to fit the sub-giant/main-sequence sections of the orange isochrone.The blue isochrone provides a good fit to the position of BPM 3066 on the Gaia CMD and in the Kiel diagram for the BSTEP parameters, as expected. However, the surface effective BSTEP metallicity ([M/H] = −0.71 ± 0.14) is larger than that obtained from the GALAH DR3 spectroscopic iron abundance ([Fe/H] = −1.33) and α enhancement ([α/Fe] = +0.54), namely [M/H] = −0.90, a value intermediate between the two plotted isochrones. We notice that the BSTEP atmospheric parameters shown in the right panel are not those recommended for use by the GALAH collaboration, which, as already mentioned, are very similar to our values. Finally, the stellar spectral energy distribution of BPM 3066 is fitted properly by an ATLAS 9 model flux with parameters similar to those adopted here, from the near ultraviolet GALEX (Galaxy Evolution Explorer) band to the infrared WISE (Wide-field Infrared Survey Explore) W3 band (see Fig. 2).
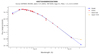 |
Fig. 2. Spectral energy distribution of BPM 3066 as obtained using the VOSA service (Bayo et al. 2008). We also show a fit with an ATLAS 9 model flux with parameters similar to those derived here. |
3.1. Light elements Li and Be
The UVES spectrum of BPM 3066 around the 7Li I region is shown in the upper panel of Fig. 3 where the observed spectrum is compared to the best fit of the 7Li I 670.78 nm resonance doublet. In the bottom panel of Fig. 3, the best fit of the 7Li Iλλ 610.36 nm 22P-32D subordinate transition is also shown. The lower level of the 7Li I 610.36 line is the upper level of the 670.78 22S-22P transition, which samples different portions of the stellar atmosphere. An average 7Li abundance of A(7Li) = 3.0 is derived from the line-profile fit of the two Li lines, at 610.36 nm and 670.78 nm. We note, however, that in order to satisfactorily reproduce the profile of the resonance doublet at 670.78 nm, no 6Li needed to be adopted. The GALAH survey reports a lithium abundance of A(Li) = 3.02 for this star, which is very close to our value.
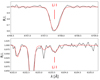 |
Fig. 3. Observed spectrum (solid black) compared to the best fit (solid red) with A(Li) = 3.0. The UVES Li I 670.78 nm region of BPM 3066 is shown in the top panel. The Li Iλλ 610.36 nm 22P-32D subordinate transition is shown in the bottom panel; the strong line on the blue side is the Ca I 610.2723 nm line. |
The UVES spectrum of BPM 3066 around the 9Be II region is shown in Fig. 4. The Be region is a complex one and the stronger line of the 9Be II doublet at 313.0 nm is blended with the V II and Fe I lines. We adopt a 9Be abundance of A(9Be) = 2.1, which is the best-fit abundance to the isolated line at 313.1 nm, but which also reproduces well the complex region at 313.04 nm. We note that the corresponding 7Be II lines (313.0583 nm, 313.1228 nm) would be distinguished from the 9Be II ones (313.0422 nm, 313.1067 nm) at the resolution of the UVES spectrum (separation Δv = 15.4 km s−1). However, given the short half-life of 7Be (53.22 days), as expected, lines from this isotope are not detected. We confirmed the reliability of the reduction process in the spectral region of the Be lines by performing a manual data reduction using the UVES pipeline, and we obtained practically indistinguishable results compared with the reduced spectrum retrieved from the ESO archive.
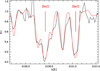 |
Fig. 4. UVES spectrum of BPM 3066 around the 9Be IIλλ 313.0422, 313.1067 nm resonance doublet region. The observed spectrum (solid black) is compared to the synthesis (solid red) on both Be II 313.0422 and 313.1067 nm resonance lines, with an abundance of A(9Be) = 2.10, the best fit value of the redder line. The 9Be region is a complex one and the stronger line of the Be II doublet is blended with V II 313.0269, Fe II 313.0565, Ti II 313.0798 nm, and several other weaker lines. |
Both the Li (see bottom panel of Fig. 5) and the Be (upper panel) abundances of BPM 3066 (red star) are much higher than expected for the metallicity of the star (blue filled circles). Besides BPM 3066, the two stars with A(Li) > 3.0 in the lower panel of Fig. 5 are LAMOSTJ074102.07+213246.6 and LAMOSTJ075816.39+470343.3 from Li et al. (2018). We plan future investigations also of their Be content.
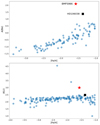 |
Fig. 5. Abundances of A(Be) (upper panel) and A(Li) (bottom panel) in BPM 3066 (red star) as a function of [Fe/H]. Blue circles are stars with 5700 < Teff < 7000 K, log g > 3.65, and [Fe/H] < −1 dex, (without upper limits) as retrieved from the SAGA database (Suda et al. 2008). Star HD106038 is marked with the black filled square, where the iron and lithium abundances are from Asplund et al. (2006) and the beryllium abundance is from Tan et al. (2009). The SAGA [Fe/H] abundances have been modified to account for the different reference solar iron abundance adopted here. |
3.2. Other elements
Star BPM 3066 looks clearly enhanced in both Li and Be, but also shows peculiarities in other elements. We fitted the NH band at 335 nm and we derived a low N abundance, [N/H] = −1.76 dex (see Table 1).
We derived all the other elements using MyGIsFOS. In this way we derived abundances for 20 additional elements, reported in Table 1. Oxygen was derived from OH molecules, while the other abundances are based on atomic lines. In Table 1, we report the abundances (A(X), [X/H]), the standard deviation (σ), [X/Fe] (with Fe from neutral lines in the case of neutral species and from ionised Fe lines in the case of ionised species), and the NLTE correction with the corresponding reference. The lines used are provided in electronic form. For elements measured from one feature only, we indicate a conservative uncertainty of 0.2 dex. In the case of Be, in the table we report the difference between the value measured from the two features but, as already mentioned, we adopt the abundance measured from the redder one.
The star is enhanced in α elements (Mg, Ca, Ti), but it is rich in Si ([Si/Fe] = +1.17 dex from neutral lines and +1.32 dex from ionised lines). The star is also rich in Al: the two Al I lines provide an [Al/Fe] ratio of almost +1 dex. The general chemical pattern is rather peculiar, with a remarkable overabundance of Si, Al, and of the neutron capture elements Sr, Y, Zr, and Ba.
4. Kinematics
Stars belonging to different populations show widely differing kinematical behaviour. Some components of the Milky Way are rapidly rotating with little dispersion in the velocities of the members, while some others are slowly rotating but with a high dispersion.
The orbital history of BPM 3066 is shown in Fig. 6. We back-integrated for 1 Gyr the stellar orbit using the galpy code (Bovy 2015), together with Gaia mission data release 3 (DR3) astrometric data (Gaia Collaboration 2023) and radial velocity. The Gaia DR3 parallax was zero-point corrected following the prescription of Lindegren et al. (2021). We adopted the standard Galactic potential MWPontential2014, the Schönrich et al. (2010) solar peculiar velocities, a distance from the Sun of 8 kpc, and a circular velocity at the solar distance of 220 km s−1 (Bovy et al. 2012). Uncertainties were evaluated by repeating the calculations for a 1000 realisations of the input parameters, with an extraction process similar to that described in Bonifacio et al. (2021, 2024) using the pyia code (Price-Whelan 2018).
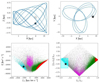 |
Fig. 6. Upper panels: Orbit of BPM 3066 in the plane of the Galaxy (Y vs. X, right panel) and in the meridional plane (Z vs. |
BPM 3066 lies at 0.45 kpc from the Sun and 0.28 kpc below the Galactic plane. It has an eccentric orbit with e = 0.59 (see upper-right panel of Fig. 6), and reaches a maximum height over the galactic plane of 0.75 kpc (upper-left panel) and minimum and maximum Galactocentric distances of rperi = 2.76 kpc and rapo = 10.62 kpc, respectively. Thus, its orbit is confined to the Galactic plane, and it wanders in regions relatively far from the Galactic centre and the Bulge. The orbit of BPM 3066 is also highly retrograde and of relatively low energy, hence it is tightly bound to the Galaxy (bottom-left panel).
The bottom panels of Fig. 6 present two of the kinematic planes most widely used to characterise stellar orbits: (i) the orbital energy, E, versus the vertical component of the angular momentum, LZ (bottom-left panel), and (ii) the so-called ‘action-diamond’, namely the difference of the vertical (JZ) and radial (JR) actions versus the azimuthal action (Jϕ = LZ), all normalised to the ‘total action’ (Jtot = |Jϕ|+JR + JZ). In both planes, besides BPM 3066 (black star), we plotted for reference the ‘good-parallax sample’ of Bonifacio et al. (2021). The stars of this sample were classified as thin disc (red), thick disc (green), and halo (grey), following the Bensby et al. (2014) criteria. Additionally, candidate stars that belong to GSE are marked in magenta and were selected following the Feuillet et al. (2021) criteria in the  versus LZ plane (which is not shown in the figure). Finally, cyan dots are candidate stars that belong to the Sequoia accretion event. The cyan rectangle shown in the action diamond (bottom-right panel) shows the criteria adopted for this selection (Feuillet et al. 2021). Clearly, according to these criteria, BPM 3066 may be a former member of the Sequoia galaxy.
As pointed out by Feuillet et al. (2021, see their Appendix C), the criteria adopted to select the Sequoia population include stars that span a wide range of energies (cyan point in the bottom-left panel), while previous selections (Myeong et al. 2019; Naidu et al. 2020) attributed Sequoia stars to the high-energy part only, the low-energy part being attributed to another structure named Thamnos (Koppelman et al. 2019; Naidu et al. 2020). If we followed these latter works, BPM 3066 would be classified as belonging to Thamnos. Therefore, caution must be exerted when comparing our results with the literature and the nomenclature adopted.
Simpson et al. (2021) separate different populations (GSE, retrograde and prograde halo, and disc stars) in the  versus Jϕ plane. The stars we select here as Sequoia candidates using the action diamond, occupy the region of the ‘retrograde halo’ in Simpson et al. (2021, see their Figures 4a and 6b). Indeed, these authors identified BPM 3066 as a lithium-rich dwarf belonging to the ‘retrograde halo’.
5. Discussion
From the Galactic 9Be-Fe relation (Molaro et al. 2020), the expected Be value for BPM 3066 is A(9Be) ≈ −0.1; the observed overabundance of beryllium above this value is therefore 2.2 dex (see Fig. 5, upper panel). A beryllium abundance excess as large as this one above the Galactic trend has never been observed in any other known star. Moreover, this is accompanied by a considerable excess of 7Li, since a Li abundance of A(Li) = 3.0 is too high considering the stellar metallicity. The star is expected to share the 7Li of the Spite plateau of about A(7Li) = 2.2 and therefore there is a 7Li overabundance of ≈0.8 dex (see Fig. 5, bottom panel). Both overabundances require a mechanism to produce and accumulate Li and Be in the stellar atmosphere. Since no significant internal mixing is expected in an unevolved star like BPM 3066, it is very likely that the process is the same for both elements. The simultaneous presence of an excess in beryllium rules out contamination from a nova or from an AGB star, which could only make lithium.
5.1. Other similar stars
A few other notable exceptions of Li-rich dwarf stars have been reported in the literature. One is BD+23 3912, with A(7Li) = 2.60 and [Fe/H] = −1.45 (Bonifacio & Molaro 1997). However, in this star beryllium was found, A(9Be) = −0.16, and it therefore lies on the linear Be-Fe relation (Boesgaard et al. 2011). Several unevolved stars with an excess of 7Li have been reported by Li et al. (2018, 2022). One star in the globular cluster M4, N. 37934, shows A(Li) = 2.87. The star is also Na rich and Monaco et al. (2011) suggested that lithium is produced in parallel to sodium. Unfortunately, beryllium investigation is out of reach for this star. A very Li-rich dwarf with A(7Li) = 4.03 has been found in the globular cluster NGC 6397 by Koch et al. (2011), and Pasquini et al. (2014) searched unsuccessfully for the presence of beryllium.
Tan et al. (2009) determined beryllium abundances for 25 metal-poor stars and one of them, star HD 106038 (filled square in Fig. 5), is very close to the case studied in this paper. HD 106038 shows A(9Be) = 1.37 ± 0.12 and A(7Li) = 2.55 at a metallicity of [Fe/H] = −1.3. Asplund et al. (2006) derived A(7Li) = 2.49 ([Fe/H] = −1.35) and Smiljanic et al. (2009) derived A(9Be) = 1.40 for this star, in good agreement with Tan et al. (2009). The star has a 7Li abundance about 0.3 dex higher than the Spite plateau and a 9Be overabundance of about 1.2 dex with respect to the other stars with a similar metallicity (see Fig. 5). The Galactic orbit of HD 106038 has been found to be typical for a halo star (Caffau et al. 2005).
Other notable stars in the Tan et al. (2009) sample are HD 126681 with [Fe/H] = −1.16 and A(9Be) = 0.68; HD 132475 with [Fe/H] = −1.49 and A(9Be) = 0.73; and HD 111980 with [Fe/H] = −1.1 and A(9Be) = 0.52. These stars deviate moderately from the scatter of the Be-Fe relations. HD 111980 shows A(7Li) = 2.19 (Ryan & Deliyannis 1995) but HD 132475 has a A(7Li) = 2.4 from GALAH that possibly shows a moderate enhancement. HD 94028 with A(9Be) = 0.68 as derived by Boesgaard & Novicki (2006) is a potential Be rich star but it was remeasured by Smiljanic et al. (2009) who derived a smaller Be abundance. Following the new determination, the star is not Be enriched.
5.2. Hypernovae as a source of 7Li and 9Be enrichment
It has been suggested that hypernovae (HNe) produce large amounts of 9Be and 7Li by spallation (Fields et al. 2002; Nakamura & Shigeyama 2004). Hypernovae are core-collapse supernovae (SNe) characterised by large kinetic energy. The energy released in the explosion can be one order of magnitude larger than that of normal core-collapse SNe (Iwamoto et al. 2003).
Fields et al. (2002) and Nakamura & Shigeyama (2004) calculated the yields of spallation products resulting from HNe explosions. Fields et al. (2002) predicted a 7Li/9Be ratio of ≈8.6 and Nakamura & Shigeyama (2004) predicted one of ≈4.2. In BPM 3066, the ratio between the observed 7Li/9Be is 7.9. In the most promising case, the yields of model (b) for SN 1998bw by Fields et al. (2002) (0.451 × 10⁻⁴ M⊙ and 0.671 × 10⁻⁵ M⊙ for 7Li and 9Be, respectively) require a dilution with a mass of 8 × 10³ M⊙ of interstellar medium to produce the observed overabundances of Li and Be. The typical mass swapped by the explosion of a core-collapse SN is ≈104 M⊙, but the mass swapped by an HN should be larger by about a factor of 20, the energy being 22 times higher, according to the results of Thornton et al. (1998). On the other hand, the oxygen and iron yields of the HN model (Woosley et al. 1999) adopted by Fields et al. (2002), respectively 2.9 and 0.5 M⊙ if diluted in 8 × 10³ M⊙ of pristine interstellar medium, produce A(Fe) = 6.2 and A(O) = 7.5, which is compatible with what is measured in our star (A(Fe) = 6.0, A(O) = 7.49). The yields obtained by Nakamura & Shigeyama (2004, 3.31 × 10⁻⁷ M⊙ and 0.999 × 10⁻⁷ M⊙ for 7Li and 9Be, respectively) for SN 1998bw are a factor of ∼136 (for 7Li) and ∼67 (for 9Be) lower than Fields et al. (2002), and the enhancement observed in BPM 3066 cannot be reached by any reasonable dilution.
Regarding the other elements, nucleosynthetic calculations find the ejecta of HNe to have large amounts of Si, S, and Ar (Nomoto et al. 2013). Oxygen burning takes place in extended regions and more O, C, and Al are burned to produce large amounts of Si, S, and Ar. Therefore, hypernova nucleosynthesis is characterised by large abundance ratios of [(Si, S)/O]. Moreover, higher energy explosions tend to produce larger [(Zn, Co, V)/Fe] and smaller [(Mn, Cr)/Fe] ratios compared to normal core-collapse SNe. Elements produced by α-rich freeze-out, such as Ca, Ti, and Zn, are also enhanced.
In Fig. 7, the abundance pattern of BPM 3066 is compared with the HN yields of Nomoto et al. (2013). Some stars have been reported as showing the products of an HN (Skúladóttir et al. 2021; Mardini et al. 2022). Some of the chemical predictions are indeed observed in BPM 3066. An overabundance of [Si/O] is a common feature of the HNe models described in the review by Nomoto et al. (2013), together with moderate enhancement of Ca and Zn. In particular, the extremely high ratio of [Si/O] ([Si/O] = 1.1 using the Si abundance measured from Si II lines) observed in BPM 3066 is compatible with the HN model of 25 M⊙ described in Umeda et al. (2002). However, the results obtained by Woosley et al. (1999), based on the HN model also used by Fields et al. (2002), do not show these extreme characteristics for the ratio of Si/O. Moreover, strong deviations of the observed abundances from the model predictions also concern N, Na, Al, Sc, V, and Cu. These elements are all observed to be enhanced in BPM 3066, while the HNe model of Woosley et al. (1999) predicts them to be deficient. An HN has been suggested as being responsible for the peculiar chemical pattern of HD 106038, which, along with Li and Be enhancements, shows also enhanced abundances of Si, Ni, Y, and Ba (Nissen & Schuster 1997; Smiljanic et al. 2008). However, we emphasise that, in a similar way to BPM 3066, in the case of HD 106038 there are observed overabundances of Na, Sc and Ti that do not agree with the HN model predictions.
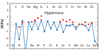 |
Fig. 7. Observed abundances of BPM 3066 in red filled squares compared with the hypernova yields from Nomoto et al. (2013). |
In BPM 3066 all the abundances of the neutron capture elements, normalised to iron, are higher than the solar ratio. Massive stars can produce neutron capture elements up to barium (Limongi & Chieffi 2018; Frischknecht et al. 2016), but the pattern is not compatible with the one observed in BPM 3066, and the yields expected by massive stars are also not sufficient to explain the extreme abundances observed in this star.
To summarise, the spallation process between the CNO nuclei ejected by an HN and the surrounding atoms in the ISM can enhance at the expected ratio the abundances of lithium and beryllium in the volume swapped by the explosion. However, the dilution needed to reproduce the Be and Li abundances in BPM 3066 is not compatible with the expected gas swapped by an HN. On the other hand, with the same dilution and considering the HN yields, we can recover the oxygen and iron abundances measured. The chemical signatures are also puzzling. The [Si/O] is compatible with models of HNe, but strong deviations are observed for N, Na, Al, Sc, V, and Cu; the barium and the other neutron capture elements could be produced by a slow-process (s-process) in massive stars, but the observed enhancement is hardly recovered.
5.3. Planet engulfment as a source of 7Li and 9Be enrichment
The engulfment of rocky planets with a high 7Li abundance has been suggested as producing 7Li excess (Siess & Livio 1999b). Alexander (1967) proposed that the engulfing of a planet or a brown dwarf could be responsible for the Li-rich giants and this idea was then revised by Brown et al. (1989), Gratton & D’Antona (1989), Siess & Livio (1999a,b), and Aguilera-Gómez et al. (2016). BPM 3066 is a dwarf and so the possibility that the star has produced such a Li enhancement in the course of its evolution is ruled out.
Ashwell et al. (2005) argued that the dwarf star J37 in the open cluster NGC 6633, with A(9Be) = 3.0 ± 0.5 and A(Li) = 4.40 ± 0.14, might be explained by the accretion of rocky material similar to that of chondritic meteorites. Planets have now been detected around stars (Mayor & Queloz 1995) and the presence of a Li feature has been reported in the atmosphere of the two ultra hot Jupiters, WASP76b and WASP121b, together with a plethora of other ionic species (Tabernero et al. 2021; Borsa et al. 2021). The presence of Li in WASP76b has been confirmed by the independent analyses of Kesseli et al. (2022) and Azevedo Silva et al. (2022).
In this context, it is interesting to note that barium was also found in WASP76b and WASP121b (strontium was also found in the latter) by using the transit technique and the extremely sensitive ESPRESSO (Echelle Spectrograph for Rocky Exoplanet and Stable Spectroscopic Observations) instrument on the ESO’s Very Large Telescope (Azevedo Silva et al. 2022).
Lithium and beryllium are also detected in planetesimals that have been accreted onto some white dwarfs (Kaiser et al. 2021; Klein et al. 2021). Hollands et al. (2020) suggest that these detections of metallic lines in the atmospheres of white dwarfs can be explained if they have accreted fragments of planetary crusts. Doyle et al. (2021) argue that the high abundance of 9Be cannot be accounted for either by diffusion in the outer envelope of the white dwarf or by chemical fractionation during typical rock-forming planetary formation. They suggest that 9Be is the result of the spallation of oxygen atoms in icy planets by the radiation from an active star in the first million years of planetary formation. Thus, observations suggest that spallation processes could be the main route for both Li and Be synthesis in a planet that is later engulfed by the star. This is clearly a particular planetary evolution and different from that of the Solar System where such over abundances of beryllium are not observed.
The likely scenario for all planets in close orbits is that they will be engulfed in the envelope of the hosting stars as the latter evolve away from the main sequence. The evolutionary routes for star-planet systems are quite complex and have been discussed in many papers (Livio & Soker 1984; Soker 1998). For planetary masses below a critical mass, there is a complete evaporation of the planet in the envelope. Aguilera-Gómez et al. (2016) calculate the point of dissipation in red giant stars, and find that objects with masses higher than > 15 MJ dissolve in the radiative interior and cannot produce an observable signature in the giant star. Thus, objects with masses < 15 MJ are the most efficient sources of Li. Aguilera-Gómez et al. (2016) find that objects with a small mass can increase the superficial Li abundance of the star up to A(Li) = 2.2. We may expect a total amount of about 2 × 1024 grams of lithium in a Jupiter-mass planet (1.9 × 1030 grams), considering a fraction of Li/H in mass of 10−6. A complete mixing with a solar-mass star (2 × 1033 grams) would give a Li/H of ∼10−9 in mass and 1.4 × 10⁻¹⁰ by number or A(Li) = 2.15. A partial mixing would increase this number while a partial presence in the exoplanets would decrease the final Li abundance. A precise computation cannot be done but the numbers suggest that the engulfment of a planet could indeed explain the Li and Be observed.
Smiljanic et al. (2009) rejected the planetary engulfment hypothesis for HD 106038 arguing that there are no planets formed around metal-poor stars. Metallicity is probably an important factor in the formation and structure of planetary systems and small planets are favoured at low metallicities (Buchhave et al. 2014; Nielsen et al. 2023). Metal-rich stars are found to be more likely to harbour gaseous-giant planets than metal-poor stars (Mortier et al. 2012; Reffert et al. 2015; Chavero et al. 2019). However, the most metal-poor stars that host a confirmed planet, according to the Encyclopaedia of Exoplanetary Systems5, have metallicities of about −2.0 (V 894 Cyg, Li & Qian 2014) and −1.4 (G 178-27, Latham et al. 1992). The number of candidate planets with a metallicity below −1.0 is much larger, so that it seems safe to conclude that planets around stars with a metallicity less than −1.0 exist, so the argument of Smiljanic et al. (2009) can be rejected on the basis of our current understanding of the properties of the stars that host an exoplanet. However, the lowest metallicity at which planets can form remains open from a theoretical perspective. Simulations by Emsenhuber et al. (2023) indicate that super-Earth and sub-Neptunes should be more frequent than what has been observed at low metallicities. The radii of discs that surround stars are predicted to decrease with decreasing metallicity, and planets are therefore expected to orbit closer to their parent stars, which favours their engulfment (Elsender & Bate 2021). We note that Santos et al. (2002) studied beryllium abundances in stars both with and without planets without finding any differences. This implies that engulfing of planets that are rich in light elements is rare, at least among high metallicity stars, as in the sample of Santos et al. (2002).
6. Conclusions
We have identified a star, BPM 3066, with extremely high Li and Be abundances. The observed ratio between the two elements strongly suggests a common origin through spallation processes. The elemental synthesis could have occurred in the environment of an hypernova. This is supported by some additional abundance anomalies besides Li and Be, such as the high value of Si observed in the star, but other elements are found to be abundant while they should be deficient according to HNe predictions.
Alternatively, the high Li and Be abundances could result from the engulfing of rocky planets where the light elements have been formed by spallation processes in the icy surfaces of the planets under the action of energetic radiation of the forming star. In the hypothesis that BPM 3066 is the result of a planet engulfment, this would provide further evidence that planets can form at metallicities of [Fe/H] < −1, adding to the existing evidence from already detected planets around low-metallicity stars and the large number of candidate planets. In any case, it is intriguing that such an extreme star has been found to belong to the Sequoia or Thamnos accreted galaxy.
Data availability
The lines used for the chemical abundance analysis are available at the CDS via anonymous ftp to cdsarc.cds.unistra.fr (130.79.128.5) or via https://cdsarc.cds.unistra.fr/viz-bin/cat/J/A+A/697/A75
‘A Catalogue of 904 Stars in the Southern Hemisphere with Proper Motions Exceeding 0T5 Annually,’ Pub. Minnesota Obs., 3, No. 1, 1941.
Acknowledgments
We thank the anonymous referee for a constructive report, which helped improve the presentation. NOIRLab IRAF is distributed by the Community Science and Data Center at NSF NOIRLab, which is managed by the Association of Universities for Research in Astronomy (AURA) under a cooperative agreement with the U.S. National Science Foundation. This research has made use of data obtained from or tools provided by the portal exoplanet.eu of The Extrasolar Planets Encyclopaedia. This publication makes use of VOSA, developed under the Spanish Virtual Observatory (https://svo.cab.inta-csic.es) project funded by MCIN/AEI/10.13039/501100011033/ through grant PID2020-112949GB-I00. VOSA has been partially updated by using funding from the European Union’s Horizon 2020 Research and Innovation Programme, under Grant Agreement n°776403 (EXOPLANETS-A). PB acknowledges support from the ERC advanced grant N. 835087 – SPIAKID. GC acknowledges the grant PRIN project No. 2022X4TM3H ‘Cosmic POT’ from Ministero dell’Università e della Ricerca (MUR). GC also thanks for the support INAF (Large Grant 2023, EPOCH) and the European Union (ChETEC-INFRA, project no. 101008324).
References
- Aguilera-Gómez, C., Chanamé, J., Pinsonneault, M. H., & Carlberg, J. K. 2016, ApJ, 829, 127 [Google Scholar]
- Alexander, J. B. 1967, The Observatory, 87, 238 [NASA ADS] [Google Scholar]
- Alvarez, R., & Plez, B. 1998, A&A, 330, 1109 [NASA ADS] [Google Scholar]
- Amarsi, A. M., Lind, K., Asplund, M., Barklem, P. S., & Collet, R. 2016, MNRAS, 463, 1518 [NASA ADS] [CrossRef] [Google Scholar]
- Ashwell, J. F., Jeffries, R. D., Smalley, B., et al. 2005, MNRAS, 363, L81 [NASA ADS] [Google Scholar]
- Asplund, M., Lambert, D. L., Nissen, P. E., Primas, F., & Smith, V. V. 2006, ApJ, 644, 229 [NASA ADS] [CrossRef] [Google Scholar]
- Azevedo Silva, T., Demangeon, O. D. S., Santos, N. C., et al. 2022, A&A, 666, L10 [NASA ADS] [CrossRef] [EDP Sciences] [Google Scholar]
- Barbá, R. H., Minniti, D., Geisler, D., et al. 2019, ApJ, 870, L24 [CrossRef] [Google Scholar]
- Barklem, P. S. 2016, Phys. Rev. A, 93, 042705 [NASA ADS] [CrossRef] [Google Scholar]
- Bayo, A., Rodrigo, C., Barrado Y Navascués, D., et al. 2008, A&A, 492, 277 [NASA ADS] [CrossRef] [EDP Sciences] [Google Scholar]
- Belokurov, V., Erkal, D., Evans, N. W., Koposov, S. E., & Deason, A. J. 2018, MNRAS, 478, 611 [Google Scholar]
- Bensby, T., Feltzing, S., & Oey, M. S. 2014, A&A, 562, A71 [NASA ADS] [CrossRef] [EDP Sciences] [Google Scholar]
- Bergemann, M. 2011, MNRAS, 413, 2184 [NASA ADS] [CrossRef] [Google Scholar]
- Bergemann, M., & Cescutti, G. 2010, A&A, 522, A9 [NASA ADS] [CrossRef] [EDP Sciences] [Google Scholar]
- Bergemann, M., Pickering, J. C., & Gehren, T. 2010, MNRAS, 401, 1334 [CrossRef] [Google Scholar]
- Bergemann, M., Lind, K., Collet, R., Magic, Z., & Asplund, M. 2012, MNRAS, 427, 27 [Google Scholar]
- Bergemann, M., Kudritzki, R.-P., Würl, M., et al. 2013, ApJ, 764, 115 [NASA ADS] [CrossRef] [Google Scholar]
- Bergemann, M., Collet, R., Amarsi, A. M., et al. 2017, ApJ, 847, 15 [NASA ADS] [CrossRef] [Google Scholar]
- Boesgaard, A. M., & Novicki, M. C. 2006, ApJ, 641, 1122 [Google Scholar]
- Boesgaard, A. M., Rich, J. A., Levesque, E. M., & Bowler, B. P. 2011, ApJ, 743, 140 [Google Scholar]
- Bonifacio, P., & Molaro, P. 1997, MNRAS, 285, 847 [NASA ADS] [CrossRef] [Google Scholar]
- Bonifacio, P., Monaco, L., Salvadori, S., et al. 2021, A&A, 651, A79 [NASA ADS] [CrossRef] [EDP Sciences] [Google Scholar]
- Bonifacio, P., Caffau, E., Monaco, L., et al. 2024, A&A, 684, A91 [NASA ADS] [CrossRef] [EDP Sciences] [Google Scholar]
- Borsa, F., Allart, R., Casasayas-Barris, N., et al. 2021, A&A, 645, A24 [EDP Sciences] [Google Scholar]
- Bovy, J. 2015, ApJS, 216, 29 [NASA ADS] [CrossRef] [Google Scholar]
- Bovy, J., Allende Prieto, C., Beers, T. C., et al. 2012, ApJ, 759, 131 [NASA ADS] [CrossRef] [Google Scholar]
- Bressan, A., Marigo, P., Girardi, L., et al. 2012, MNRAS, 427, 127 [NASA ADS] [CrossRef] [Google Scholar]
- Brown, J. A., Sneden, C., Lambert, D. L., & Dutchover, E. Jr 1989, ApJS, 71, 293 [NASA ADS] [CrossRef] [Google Scholar]
- Buchhave, L. A., Bizzarro, M., Latham, D. W., et al. 2014, Nature, 509, 593 [Google Scholar]
- Buder, S., Sharma, S., Kos, J., et al. 2021, MNRAS, 506, 150 [NASA ADS] [CrossRef] [Google Scholar]
- Caffau, E., Bonifacio, P., Faraggiana, R., et al. 2005, A&A, 441, 533 [NASA ADS] [CrossRef] [EDP Sciences] [Google Scholar]
- Caffau, E., Faraggiana, R., Ludwig, H. G., Bonifacio, P., & Steffen, M. 2011a, Astron. Nachr., 332, 128 [NASA ADS] [CrossRef] [Google Scholar]
- Caffau, E., Ludwig, H. G., Steffen, M., Freytag, B., & Bonifacio, P. 2011b, Sol. Phys., 268, 255 [Google Scholar]
- Caffau, E., Bonifacio, P., Monaco, L., et al. 2024, A&A, 691, A245 [NASA ADS] [CrossRef] [EDP Sciences] [Google Scholar]
- Chavero, C., de la Reza, R., Ghezzi, L., et al. 2019, MNRAS, 487, 3162 [Google Scholar]
- Coc, A., & Vangioni, E. 2017, Int. J. Mod. Phys. E, 26, 1741002 [CrossRef] [Google Scholar]
- Dekker, H., D’Odorico, S., Kaufer, A., Delabre, B., & Kotzlowski, H. 2000, in Optical and IR Telescope Instrumentation and Detectors, eds. M. Iye, & A. F. Moorwood, SPIE Conf. Ser., 4008, 534 [Google Scholar]
- Doyle, A. E., Desch, S. J., & Young, E. D. 2021, ApJ, 907, L35 [NASA ADS] [CrossRef] [Google Scholar]
- Drawin, H.-W. 1968, Z. Phys., 211, 404 [NASA ADS] [CrossRef] [Google Scholar]
- Drawin, H. W. 1969, Z. Phys., 225, 483 [CrossRef] [Google Scholar]
- Elsender, D., & Bate, M. R. 2021, MNRAS, 508, 5279 [NASA ADS] [CrossRef] [Google Scholar]
- Emsenhuber, A., Mordasini, C., & Burn, R. 2023, Eur. Phys. J. Plus, 138, 181 [NASA ADS] [CrossRef] [Google Scholar]
- Feuillet, D. K., Sahlholdt, C. L., Feltzing, S., & Casagrande, L. 2021, MNRAS, 508, 1489 [NASA ADS] [CrossRef] [Google Scholar]
- Fields, B. D., Daigne, F., Cassé, M., & Vangioni-Flam, E. 2002, ApJ, 581, 389 [NASA ADS] [CrossRef] [Google Scholar]
- Fitzpatrick, M., Placco, V., Bolton, A., et al. 2024, arXiv e-prints [arXiv:2401.01982] [Google Scholar]
- Frischknecht, U., Hirschi, R., Pignatari, M., et al. 2016, MNRAS, 456, 1803 [Google Scholar]
- Gaia Collaboration (Vallenari, A., et al.) 2023, A&A, 674, A1 [NASA ADS] [CrossRef] [EDP Sciences] [Google Scholar]
- Gratton, R. G., & D’Antona, F. 1989, A&A, 215, 66 [NASA ADS] [Google Scholar]
- Haywood, M., Di Matteo, P., Lehnert, M. D., et al. 2018, ApJ, 863, 113 [Google Scholar]
- Helmi, A., Babusiaux, C., Koppelman, H. H., et al. 2018, Nature, 563, 85 [Google Scholar]
- Hollands, M. A., Tremblay, P. E., Gänsicke, B. T., et al. 2020, Nat. Astron., 4, 663 [CrossRef] [Google Scholar]
- Iwamoto, K., Nomoto, K., Mazzali, P. A., Nakamura, T., & Maeda, K. 2003, in Supernovae and Gamma-Ray Bursters, ed. K. Weiler, 598, 243 [Google Scholar]
- Kaiser, B. C., Clemens, J. C., Blouin, S., et al. 2021, Science, 371, 168 [NASA ADS] [CrossRef] [Google Scholar]
- Kesseli, A. Y., Snellen, I. A. G., Casasayas-Barris, N., Mollière, P., & Sánchez-López, A. 2022, AJ, 163, 107 [NASA ADS] [CrossRef] [Google Scholar]
- Klein, B. L., Doyle, A. E., Zuckerman, B., et al. 2021, ApJ, 914, 61 [NASA ADS] [CrossRef] [Google Scholar]
- Koch, A., Lind, K., & Rich, R. M. 2011, ApJ, 738, L29 [NASA ADS] [CrossRef] [Google Scholar]
- Koppelman, H. H., Helmi, A., Massari, D., Price-Whelan, A. M., & Starkenburg, T. K. 2019, A&A, 631, L9 [NASA ADS] [CrossRef] [EDP Sciences] [Google Scholar]
- Kurucz, R. L. 2005, Mem. Soc. Astron. It. Suppl., 8, 14 [Google Scholar]
- Latham, D. W., Mazeh, T., Stefanik, R. P., et al. 1992, AJ, 104, 774 [Google Scholar]
- Li, L. J., & Qian, S. B. 2014, MNRAS, 444, 600 [CrossRef] [Google Scholar]
- Li, H., Aoki, W., Matsuno, T., et al. 2018, ApJ, 852, L31 [NASA ADS] [CrossRef] [Google Scholar]
- Li, H., Aoki, W., Matsuno, T., et al. 2022, ApJ, 931, 147 [NASA ADS] [CrossRef] [Google Scholar]
- Limongi, M., & Chieffi, A. 2018, ApJS, 237, 13 [NASA ADS] [CrossRef] [Google Scholar]
- Lindegren, L., Bastian, U., Biermann, M., et al. 2021, A&A, 649, A4 [EDP Sciences] [Google Scholar]
- Livio, M., & Soker, N. 1984, MNRAS, 208, 763 [NASA ADS] [CrossRef] [Google Scholar]
- Lodders, K., Palme, H., & Gail, H. P. 2009, Landolt Börnstein, 4B, 712 [Google Scholar]
- Lombardo, L., François, P., Bonifacio, P., et al. 2021, A&A, 656, A155 [NASA ADS] [CrossRef] [EDP Sciences] [Google Scholar]
- Lombardo, L., Bonifacio, P., Caffau, E., et al. 2023, MNRAS, 522, 4815 [CrossRef] [Google Scholar]
- Luyten, W. J., & Dartayet, M. 1942, ApJ, 96, 55 [Google Scholar]
- Malaney, R. A., & Fowler, W. A. 1989, ApJ, 345, L5 [Google Scholar]
- Mardini, M. K., Frebel, A., Ezzeddine, R., et al. 2022, MNRAS, 517, 3993 [NASA ADS] [CrossRef] [Google Scholar]
- Mashonkina, L., Korn, A. J., & Przybilla, N. 2007, A&A, 461, 261 [NASA ADS] [CrossRef] [EDP Sciences] [Google Scholar]
- Mashonkina, L., Jablonka, P., Pakhomov, Y., Sitnova, T., & North, P. 2017, A&A, 604, A129 [NASA ADS] [CrossRef] [EDP Sciences] [Google Scholar]
- Mayor, M., & Queloz, D. 1995, Nature, 378, 355 [Google Scholar]
- Molaro, P. 2023, Mem. Soc. Astron. It., 94, 22 [Google Scholar]
- Molaro, P., Bonifacio, P., Castelli, F., & Pasquini, L. 1997, A&A, 319, 593 [NASA ADS] [Google Scholar]
- Molaro, P., Cescutti, G., & Fu, X. 2020, MNRAS, 496, 2902 [Google Scholar]
- Monaco, L., Villanova, S., Moni Bidin, C., et al. 2011, A&A, 529, A90 [NASA ADS] [CrossRef] [EDP Sciences] [Google Scholar]
- Mortier, A., Santos, N. C., Sozzetti, A., et al. 2012, A&A, 543, A45 [NASA ADS] [CrossRef] [EDP Sciences] [Google Scholar]
- Myeong, G. C., Vasiliev, E., Iorio, G., Evans, N. W., & Belokurov, V. 2019, MNRAS, 488, 1235 [Google Scholar]
- Naidu, R. P., Conroy, C., Bonaca, A., et al. 2020, ApJ, 901, 48 [Google Scholar]
- Nakamura, K., & Shigeyama, T. 2004, ApJ, 610, 888 [Google Scholar]
- Nielsen, J., Gent, M. R., Bergemann, M., Eitner, P., & Johansen, A. 2023, A&A, 678, A74 [NASA ADS] [CrossRef] [EDP Sciences] [Google Scholar]
- Nissen, P. E., & Schuster, W. J. 1997, A&A, 326, 751 [NASA ADS] [Google Scholar]
- Nomoto, K., Kobayashi, C., & Tominaga, N. 2013, ARA&A, 51, 457 [CrossRef] [Google Scholar]
- Pasquini, L., Koch, A., Smiljanic, R., Bonifacio, P., & Modigliani, A. 2014, A&A, 563, A3 [Google Scholar]
- Plez, B. 2012, Turbospectrum: Code for spectral synthesis, Astrophysics Source Code Library [record ascl:1205.004] [Google Scholar]
- Price-Whelan, A. 2018, https://doi.org/10.5281/zenodo.1228136 [Google Scholar]
- Primas, F., Molaro, P., Bonifacio, P., & Hill, V. 2000, A&A, 362, 666 [NASA ADS] [Google Scholar]
- Reeves, H., Fowler, W. A., & Hoyle, F. 1970, Nature, 226, 727 [Google Scholar]
- Reffert, S., Bergmann, C., Quirrenbach, A., Trifonov, T., & Künstler, A. 2015, A&A, 574, A116 [NASA ADS] [CrossRef] [EDP Sciences] [Google Scholar]
- Ryan, S. G., & Deliyannis, C. P. 1995, ApJ, 453, 819 [NASA ADS] [CrossRef] [Google Scholar]
- Salaris, M., & Cassisi, S. 2005, Evolution of Stars and Stellar Populations (Wiley-VCH) [Google Scholar]
- Santos, N. C., García López, R. J., Israelian, G., et al. 2002, A&A, 386, 1028 [NASA ADS] [CrossRef] [EDP Sciences] [Google Scholar]
- Sbordone, L., Caffau, E., Bonifacio, P., & Duffau, S. 2014, A&A, 564, A109 [NASA ADS] [CrossRef] [EDP Sciences] [Google Scholar]
- Schlafly, E. F., & Finkbeiner, D. P. 2011, ApJ, 737, 103 [Google Scholar]
- Schönrich, R., Binney, J., & Dehnen, W. 2010, MNRAS, 403, 1829 [NASA ADS] [CrossRef] [Google Scholar]
- Sharma, S., Stello, D., Buder, S., et al. 2018, MNRAS, 473, 2004 [NASA ADS] [CrossRef] [Google Scholar]
- Siess, L., & Livio, M. 1999a, MNRAS, 304, 925 [Google Scholar]
- Siess, L., & Livio, M. 1999b, MNRAS, 308, 1133 [Google Scholar]
- Simpson, J. D., Martell, S. L., Buder, S., et al. 2021, MNRAS, 507, 43 [NASA ADS] [CrossRef] [Google Scholar]
- Skúladóttir, Á., Salvadori, S., Amarsi, A. M., et al. 2021, ApJ, 915, L30 [CrossRef] [Google Scholar]
- Smiljanic, R., Pasquini, L., Primas, F., et al. 2008, MNRAS, 385, L93 [NASA ADS] [CrossRef] [Google Scholar]
- Smiljanic, R., Pasquini, L., Bonifacio, P., et al. 2009, A&A, 499, 103 [NASA ADS] [CrossRef] [EDP Sciences] [Google Scholar]
- Smiljanic, R., Zych, M. G., & Pasquini, L. 2021, A&A, 646, A70 [NASA ADS] [CrossRef] [EDP Sciences] [Google Scholar]
- Soker, N. 1998, AJ, 116, 1308 [Google Scholar]
- Spite, F., & Spite, M. 1982, A&A, 115, 357 [NASA ADS] [Google Scholar]
- Steenbock, W., & Holweger, H. 1984, A&A, 130, 319 [NASA ADS] [Google Scholar]
- Suda, T., Katsuta, Y., Yamada, S., et al. 2008, PASJ, 60, 1159 [NASA ADS] [Google Scholar]
- Tabernero, H. M., Zapatero Osorio, M. R., Allart, R., et al. 2021, A&A, 646, A158 [NASA ADS] [CrossRef] [EDP Sciences] [Google Scholar]
- Tan, K. F., Shi, J. R., & Zhao, G. 2009, MNRAS, 392, 205 [Google Scholar]
- Thornton, K., Gaudlitz, M., Janka, H. T., & Steinmetz, M. 1998, ApJ, 500, 95 [CrossRef] [Google Scholar]
- Tody, D. 1986, in Instrumentation in astronomy VI, ed. D. L. Crawford, SPIE Conf. Ser., 627, 733 [Google Scholar]
- Tody, D. 1993, in Astronomical Data Analysis Software and Systems II, eds. R. J. Hanisch, R. J. V. Brissenden, & J. Barnes, ASP Conf. Ser., 52, 173 [Google Scholar]
- Tonry, J., & Davis, M. 1979, AJ, 84, 1511 [Google Scholar]
- Umeda, H., Nomoto, K., Tsuru, T. G., & Matsumoto, H. 2002, ApJ, 578, 855 [Google Scholar]
- Villanova, S., Monaco, L., Geisler, D., et al. 2019, ApJ, 882, 174 [NASA ADS] [CrossRef] [Google Scholar]
- Woosley, S. E., Eastman, R. G., & Schmidt, B. P. 1999, ApJ, 516, 788 [NASA ADS] [CrossRef] [Google Scholar]
- Zacharias, N., Finch, C. T., Girard, T. M., et al. 2013, AJ, 145, 44 [Google Scholar]
All Tables
All Figures
|
Fig. 1. Left and middle panels: V vs. (B − V) and Gaia G vs. (GBP − GRP) colour-magnitude diagrams (CMDs). Right panel: Kiel diagram, log g vs. Teff. Star BPM 3066 is indicated by the filled star. In the right panel, the orange star is for the parameters we adopt here, while the blue one is for the GALAH BSTEP parameters. In all panels, two PARSEC isochrones of metallicity and ages ([M/H], Age) = (−0.71, 11.7) and (−1.26, 13.0) are shown in blue and orange, respectively. |
| In the text | |
|
Fig. 2. Spectral energy distribution of BPM 3066 as obtained using the VOSA service (Bayo et al. 2008). We also show a fit with an ATLAS 9 model flux with parameters similar to those derived here. |
| In the text | |
|
Fig. 3. Observed spectrum (solid black) compared to the best fit (solid red) with A(Li) = 3.0. The UVES Li I 670.78 nm region of BPM 3066 is shown in the top panel. The Li Iλλ 610.36 nm 22P-32D subordinate transition is shown in the bottom panel; the strong line on the blue side is the Ca I 610.2723 nm line. |
| In the text | |
|
Fig. 4. UVES spectrum of BPM 3066 around the 9Be IIλλ 313.0422, 313.1067 nm resonance doublet region. The observed spectrum (solid black) is compared to the synthesis (solid red) on both Be II 313.0422 and 313.1067 nm resonance lines, with an abundance of A(9Be) = 2.10, the best fit value of the redder line. The 9Be region is a complex one and the stronger line of the Be II doublet is blended with V II 313.0269, Fe II 313.0565, Ti II 313.0798 nm, and several other weaker lines. |
| In the text | |
|
Fig. 5. Abundances of A(Be) (upper panel) and A(Li) (bottom panel) in BPM 3066 (red star) as a function of [Fe/H]. Blue circles are stars with 5700 < Teff < 7000 K, log g > 3.65, and [Fe/H] < −1 dex, (without upper limits) as retrieved from the SAGA database (Suda et al. 2008). Star HD106038 is marked with the black filled square, where the iron and lithium abundances are from Asplund et al. (2006) and the beryllium abundance is from Tan et al. (2009). The SAGA [Fe/H] abundances have been modified to account for the different reference solar iron abundance adopted here. |
| In the text | |
|
Fig. 6. Upper panels: Orbit of BPM 3066 in the plane of the Galaxy (Y vs. X, right panel) and in the meridional plane (Z vs. |
| In the text | |
|
Fig. 7. Observed abundances of BPM 3066 in red filled squares compared with the hypernova yields from Nomoto et al. (2013). |
| In the text | |
Current usage metrics show cumulative count of Article Views (full-text article views including HTML views, PDF and ePub downloads, according to the available data) and Abstracts Views on Vision4Press platform.
Data correspond to usage on the plateform after 2015. The current usage metrics is available 48-96 hours after online publication and is updated daily on week days.
Initial download of the metrics may take a while.