Open Access
Fig. 3.
Download original image
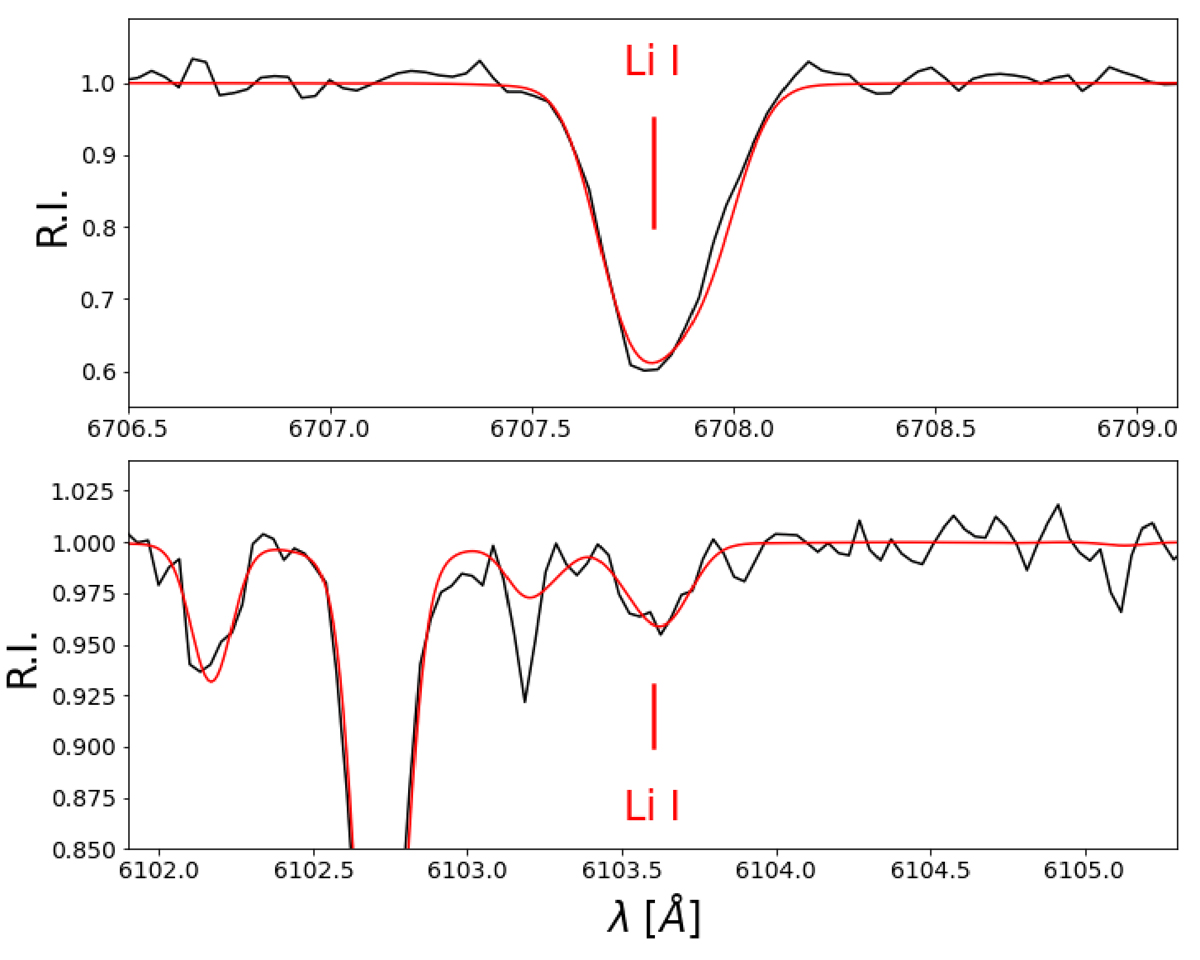
Observed spectrum (solid black) compared to the best fit (solid red) with A(Li) = 3.0. The UVES Li I 670.78 nm region of BPM 3066 is shown in the top panel. The Li Iλλ 610.36 nm 22P-32D subordinate transition is shown in the bottom panel; the strong line on the blue side is the Ca I 610.2723 nm line.
Current usage metrics show cumulative count of Article Views (full-text article views including HTML views, PDF and ePub downloads, according to the available data) and Abstracts Views on Vision4Press platform.
Data correspond to usage on the plateform after 2015. The current usage metrics is available 48-96 hours after online publication and is updated daily on week days.
Initial download of the metrics may take a while.