Fig. 6.
Download original image
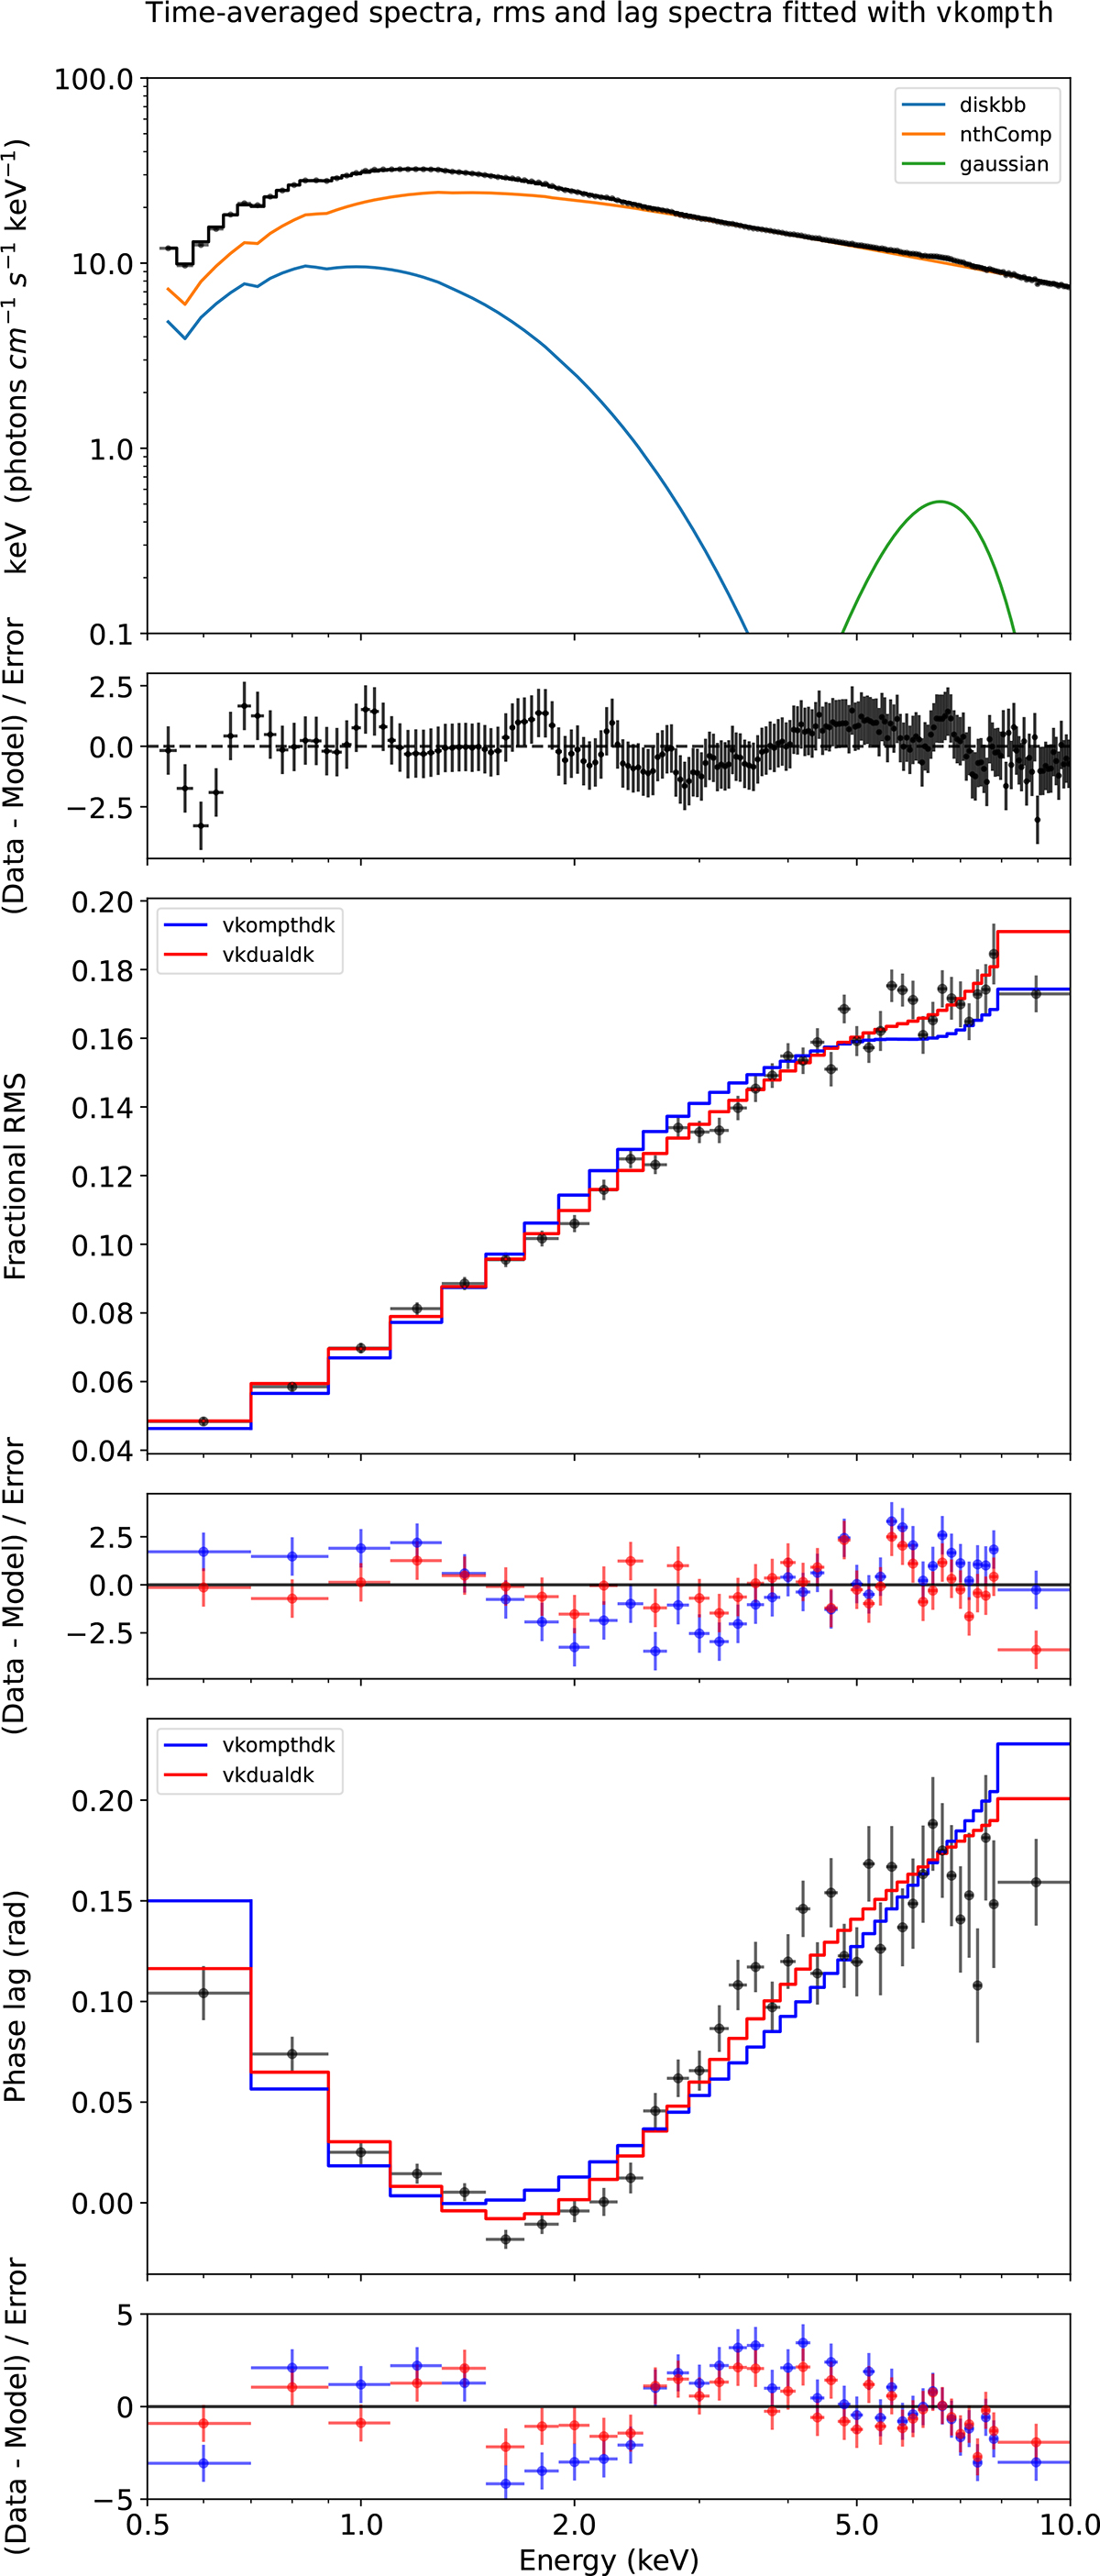
Top panel shows the NICER time-averaged spectrum of Swift J1727.8–1613 (ObsID 6203980105) with a QPO centroid frequency of 0.89 Hz, fitted using the model TBfeo*(diskbb + gaussian + nthComp) together with the residuals of the best-fitting model. The middle panel shows the RMS spectrum of the QPO fitted with the vkdualdk*dilution (red) and vkompthdk*dilution (blue) models with the residuals of the best-fitting model. The bottom panel shows the phase-lag spectrum of at the QPO fitted with the vkdualdk (red) and vkompthdk model (blue) with the residuals of the best-fitting model. The 0.5–10.0 keV energy band is used as the reference for the phase-lag spectra.
Current usage metrics show cumulative count of Article Views (full-text article views including HTML views, PDF and ePub downloads, according to the available data) and Abstracts Views on Vision4Press platform.
Data correspond to usage on the plateform after 2015. The current usage metrics is available 48-96 hours after online publication and is updated daily on week days.
Initial download of the metrics may take a while.