Fig. 7.
Download original image
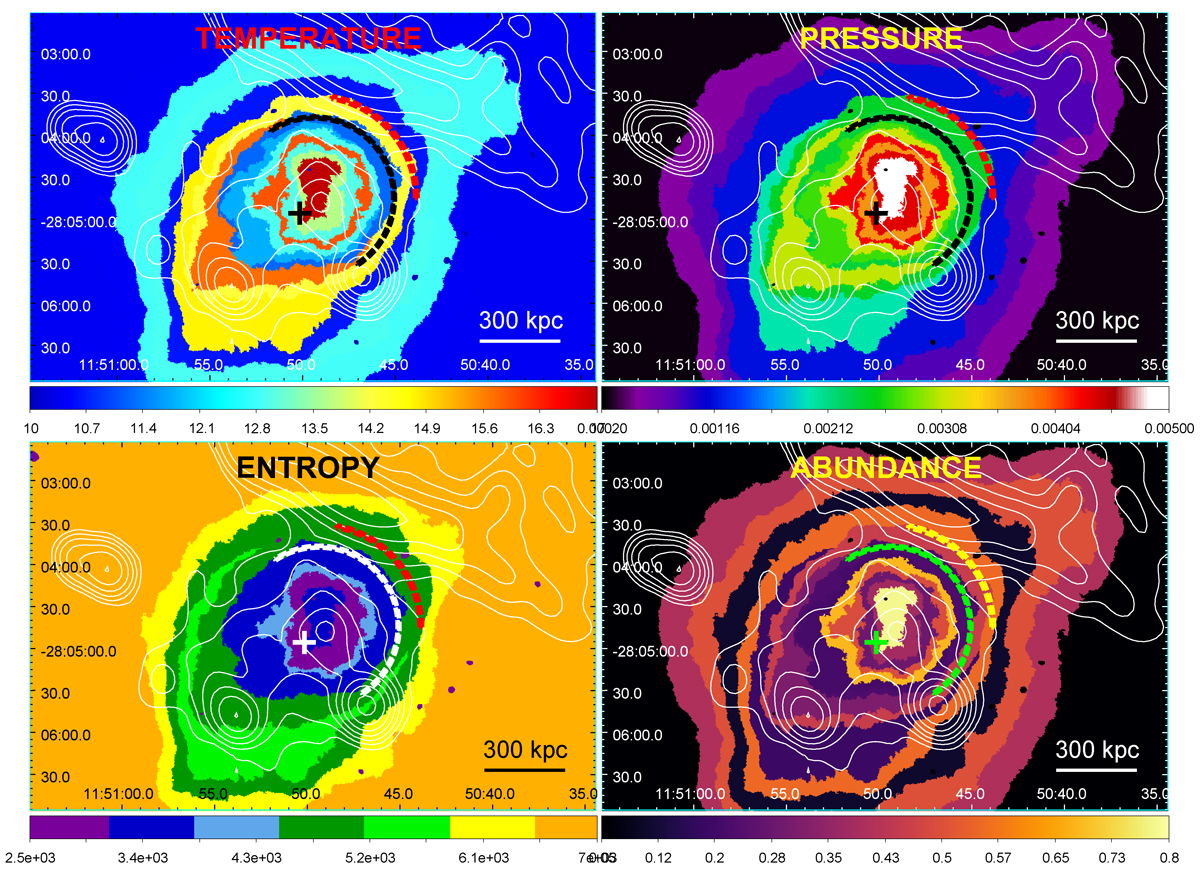
Spectral maps of the ICM thermodynamical properties in PLCKG287 (see Sect. 3.2.3 for details) with overlaid the GMRT radio contours at 330 MHz (same as in Fig. 2). Upper panels: temperature (keV) and pseudo-pressure (arbitrary units) maps. Bottom panels: pseudo-entropy (arbitrary units) and abundance (solar units) maps. The dashed arcs (indicated in different colors in the various panels to enhance visibility depending on the color scale adopted) mark the positions of the surface brightness edges detected in Sect. 4. All maps are centered in the X-ray peak, whereas the cross indicates the location of the main BCG.
Current usage metrics show cumulative count of Article Views (full-text article views including HTML views, PDF and ePub downloads, according to the available data) and Abstracts Views on Vision4Press platform.
Data correspond to usage on the plateform after 2015. The current usage metrics is available 48-96 hours after online publication and is updated daily on week days.
Initial download of the metrics may take a while.