Fig. 6.
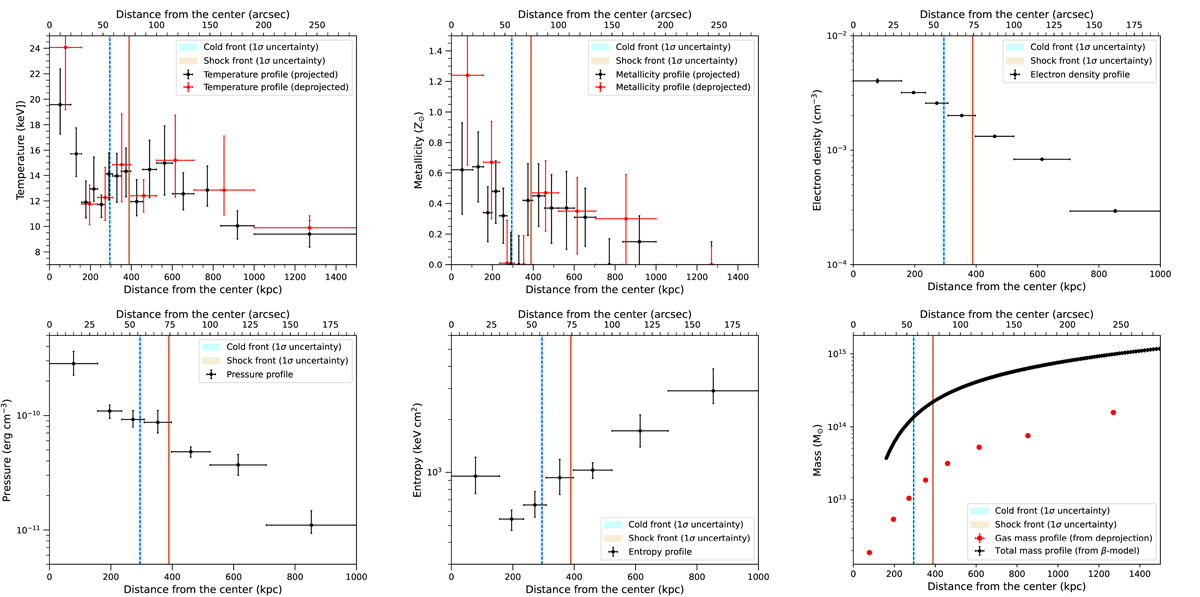
Download original image
Radial profiles of PLCKG287 obtained from the Chandra spectral analysis. Top panels: temperature (left) and metallicity (middle) from the projected (black) and deprojected (red) spectral analysis; the right panel shows the deprojected density (see Tables B.1 and B.2). Bottom panels: Pressure (left), entropy (middle), and integrated gas mass (right, red points) from the deprojected spectral analysis (see Table B.2). The total mass profile (right, solid black line) was estimated from the circular β-model by assuming an isothermal kT ∼ 12.7 keV. In all panels, the vertical lines show the position of the fronts discussed in Sect. 4 (the dashed blue line and solid red line indicate the cold front and shock, respectively).
Current usage metrics show cumulative count of Article Views (full-text article views including HTML views, PDF and ePub downloads, according to the available data) and Abstracts Views on Vision4Press platform.
Data correspond to usage on the plateform after 2015. The current usage metrics is available 48-96 hours after online publication and is updated daily on week days.
Initial download of the metrics may take a while.