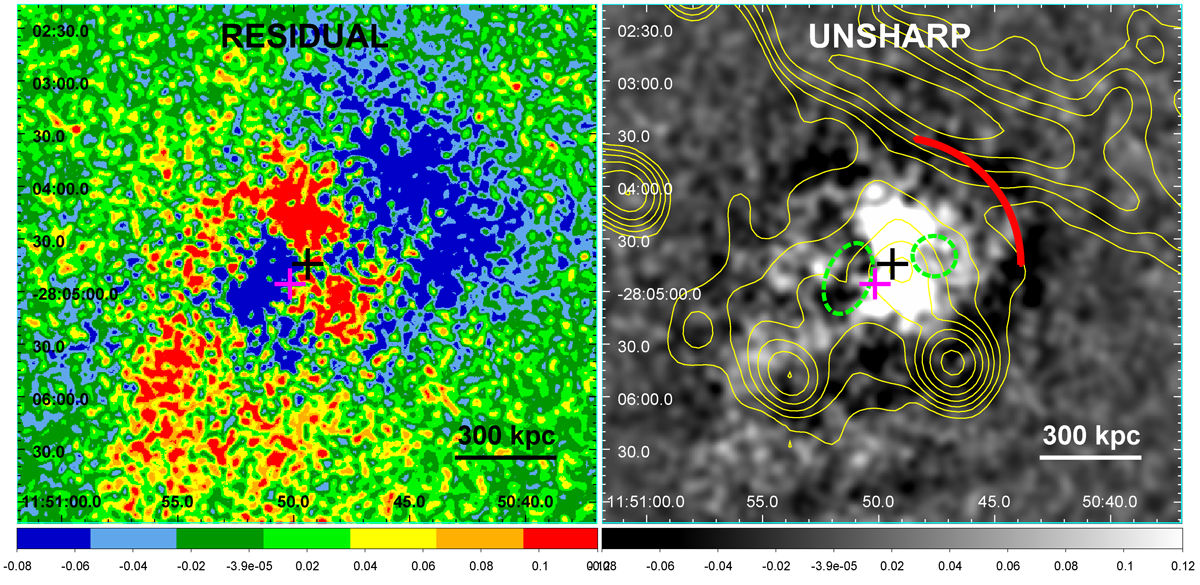
Fig. 4.
Download original image
Morphological substructures in PLCKG287 from filtered Chandra images. Left panel: residual Chandra image of the central cluster region obtained by subtracting the best-fit elliptical β-model (see Table 2). As is indicated by the color bar, the positive and negative residuals are shown in red and blue, respectively. Right panel: unsharp masked image obtained by subtracting a 40″-smoothed image from a 5″-smoothed one. The dashed green ellipses show the possible X-ray depressions discussed in Sect. 5.4, whereas the red arc indicates the position of the identified shock front (see Sect. 4). Overlaid are the GMRT radio contours at 330 MHz (same as in Fig. 2). In both panels, the black and magenta crosses indicate the location of the X-ray peak (RA 11:50:49.4, Dec −28:04:44.3) and main BCG (RA 11:50:50.2, Dec −28:04:55.7), respectively.
Current usage metrics show cumulative count of Article Views (full-text article views including HTML views, PDF and ePub downloads, according to the available data) and Abstracts Views on Vision4Press platform.
Data correspond to usage on the plateform after 2015. The current usage metrics is available 48-96 hours after online publication and is updated daily on week days.
Initial download of the metrics may take a while.