Fig. A.1.
Download original image
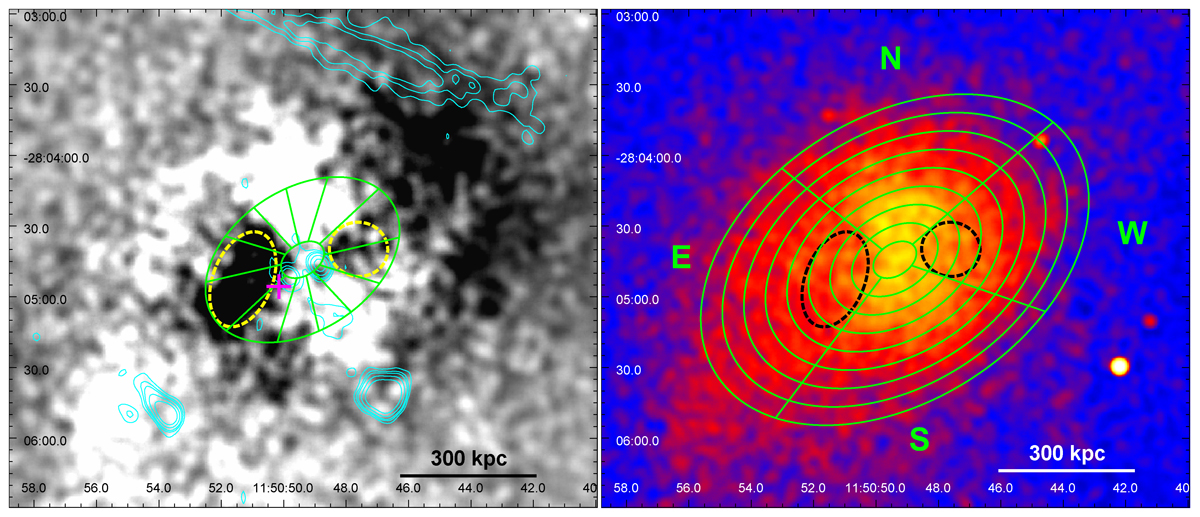
Surface brightness regions used for the analysis of the depressions in the ICM of PLCKG287. Left panel: Residual Chandra image of the central cluster region obtained by subtracting the best-fit β-model (same as in Fig. 4, left panel) with superimposed the GMRT radio contours at 610 MHz (same as in Fig. 11). The elliptical wedges used to evaluate the azimuthal SB profile around the center were chosen so as to mostly encompass the region of each depression (elliptical annulus between 10″ and 45″ along the major axis, divided in 12 sectors of 30° each) and are shown in green panda regions. The magenta cross indicates the location of the main BCG. Right panel: Background-subtracted, exposure-corrected mosaic [0.5-7.0] keV Chandra image, smoothed with a kernel of 8 pixels, of the same central region of PLCKG287 as in the left panel. The elliptical wedges used to extract the radial SB profile in 5″-wide annular bin along four azimuthal sectors (N: 8° - 108°, E: 108° - 200°, S: 200° - 308°, W: 308° - 368°) are shown in green panda regions (to improve clarity, the annular bins shown in Fig. are 10″-wide instead of 5″-wide). The geometry is the same as that of the elliptical β-model (see Table 2). In both panels, the dashed ellipses show the possible X-ray cavities identified in Sect. 3.1 and discussed in Sect. 5.5.2.
Current usage metrics show cumulative count of Article Views (full-text article views including HTML views, PDF and ePub downloads, according to the available data) and Abstracts Views on Vision4Press platform.
Data correspond to usage on the plateform after 2015. The current usage metrics is available 48-96 hours after online publication and is updated daily on week days.
Initial download of the metrics may take a while.