Fig. 11.
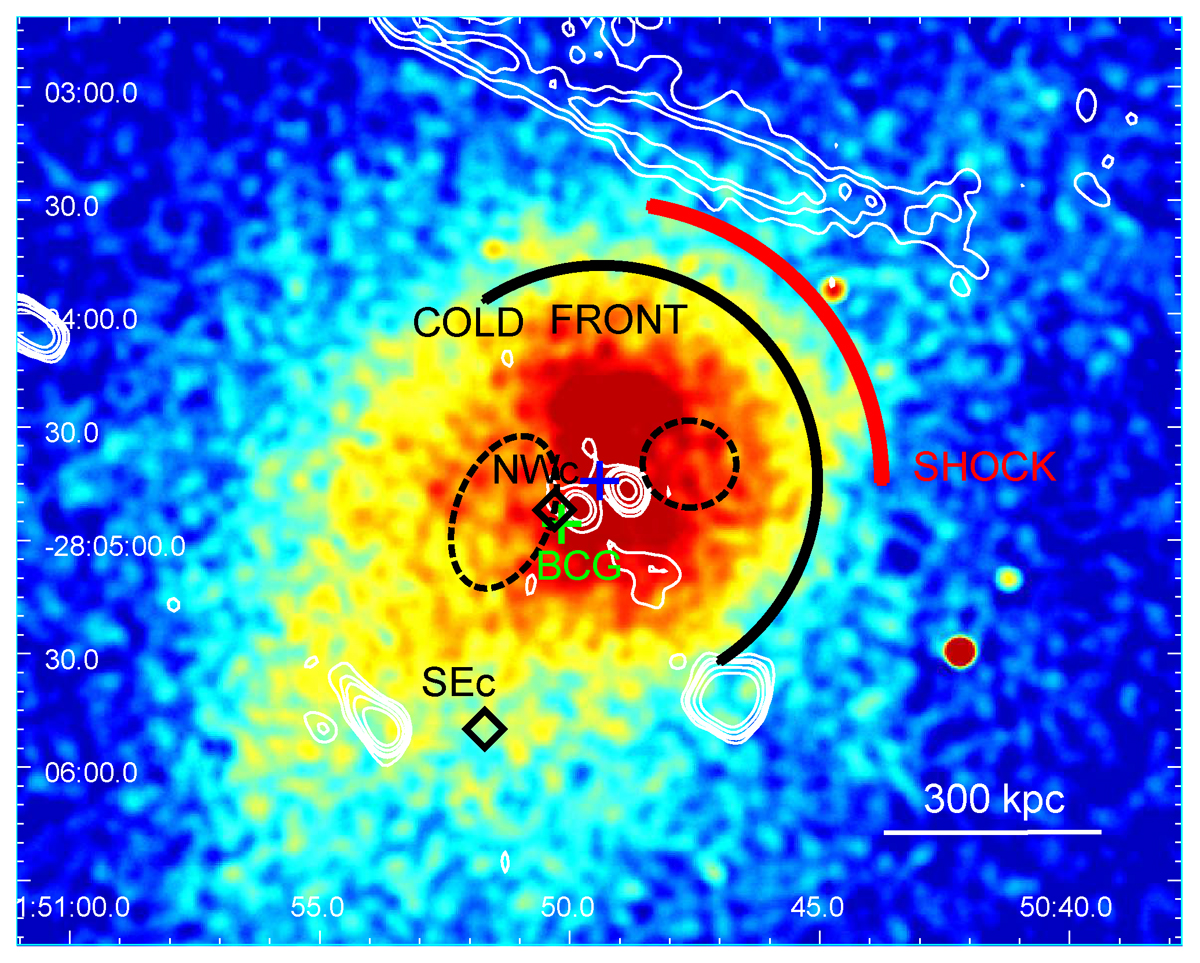
Download original image
Background-subtracted, exposure corrected mosaic [0.5–7.0] keV Chandra image, smoothed with a kernel of 8 pixels, of the central region of PLCKG287, with superimposed in white the GMRT radio contours at 610 MHz (levels start at ±3σ and increase by a factor of 2, where σ = 0.07 mJy/beam, beam = 6.7″ × 5.3″, Bonafede et al. 2014). The dashed black ellipses show the possible X-ray cavities, whereas the red and black arcs indicates the position of the shock and cold front, respectively. The locations of the X-ray peak and main BCG are indicated by blue and green crosses, respectively, whereas the positions of the dark matter substructures identified by weak lensing analysis are shown by black diamonds and labeled following the same nomenclature as in Finner et al. (2017).
Current usage metrics show cumulative count of Article Views (full-text article views including HTML views, PDF and ePub downloads, according to the available data) and Abstracts Views on Vision4Press platform.
Data correspond to usage on the plateform after 2015. The current usage metrics is available 48-96 hours after online publication and is updated daily on week days.
Initial download of the metrics may take a while.