Fig. 8
Download original image
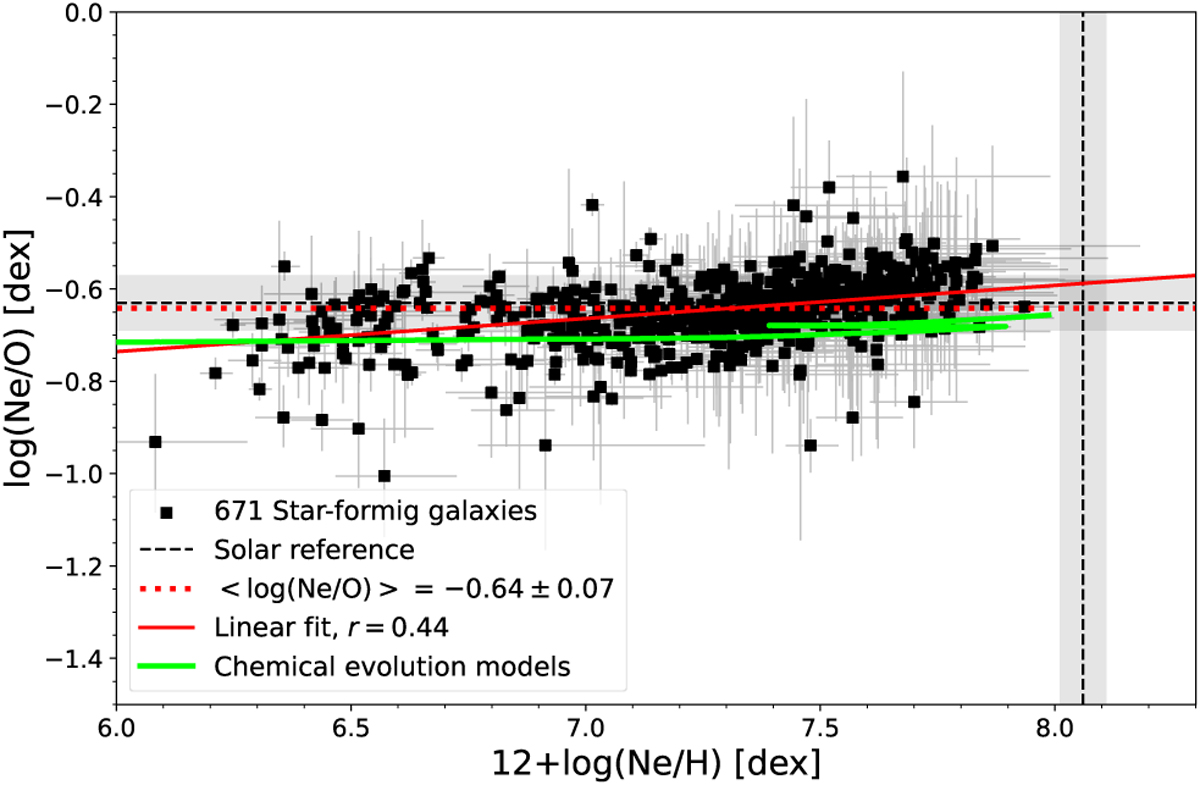
log(Ne/O) as a function of 12+log(Ne/H) for SFGs of the DESIRED-E sample, which Ne/O ratios have been calculated using the ICF(Ne) scheme by Izotov et al. (2006). The red continuous line represents a linear fit to the data. The green continuous line shows the time evolution of Ne and O abundances of the ISM predicted by the CEM of the Milky Way of Medina-Amayo (2023). The dotted red line represents the mean value of log(Ne/O). The black dashed lines and the grey bands show the solar 12+log(Ne/H) and log(Ne/O) and their associated uncertainties, respectively, from Asplund et al. (2021).
Current usage metrics show cumulative count of Article Views (full-text article views including HTML views, PDF and ePub downloads, according to the available data) and Abstracts Views on Vision4Press platform.
Data correspond to usage on the plateform after 2015. The current usage metrics is available 48-96 hours after online publication and is updated daily on week days.
Initial download of the metrics may take a while.