| Issue |
A&A
Volume 697, May 2025
|
|
|---|---|---|
| Article Number | A131 | |
| Number of page(s) | 9 | |
| Section | Interstellar and circumstellar matter | |
| DOI | https://doi.org/10.1051/0004-6361/202453261 | |
| Published online | 15 May 2025 | |
Magnetic field properties of the supernova remnant HB 9
1
National Astronomical Observatories, Chinese Academy of Sciences,
Jia-20, Datun Road,
100012
Beijing,
China
2
Key Laboratory of FAST, NAOC, Chinese Academy of Science,
100012
Beijing,
China
3
Guizhou Radio Astronomical Observatory, Guizhou University,
550000
Guiyang,
China
4
School of Physics and Astronomy, Yunnan University,
650091
Kunming,
China
5
Max-Planck-Institut für Radioastronomie,
Auf dem Hügel 69,
53121
Bonn,
Germany
★ Corresponding authors; This email address is being protected from spambots. You need JavaScript enabled to view it.
, This email address is being protected from spambots. You need JavaScript enabled to view it.
Received:
2
December
2024
Accepted:
16
March
2025
Abstract
Aims. We aim to study the polarization and magnetic field properties of the supernova remnant HB 9 using new 21-cm continuum cube data from the Five-hundred-meter Aperture Spherical Radio Telescope (FAST).
Methods. We computed the Faraday depth at 21 cm and re-analyzed the rotation measures (RMs) of HB 9 using additional Effelsberg 2695-MHz and Urumqi 4800-MHz polarization data. FAST total-intensity images of two subbands were decomposed into components of multiple angular scales to check spectral-index variation via temperature versus temperature plots (TT-plots).
Results. The filamentary emission has a spectral index (S ~ να) of α = −0.52, which corresponds to freshly accelerated relativistic electrons. The diffuse emission has a steeper spectrum of α = −0.63, which corresponds to confined electrons that are no longer accelerated. The FAST detected 1385-MHz polarized emission that might come from a thin layer in the outer envelope of the shells, with a Faraday depth of 4–28 rad m−2 from the Faraday rotation synthesis result. The RMs derived from the Effelsberg 2695-MHz and Urumqi 4800-MHz polarization data show about 70 rad m−2 in the eastern and northern shell, and 124 rad m−2 in the inner and southern patches. The regular magnetic field is about 5–8 μG over the remnant. The northern shell shows depolarization at 2695 MHz relative to the 4800-MHz polarization data, which indicates an additional random magnetic field of 12 μG on the scale of 0.6 pc. The shock wave might have entered the dense gas environment in the northern-shell region and has driven turbulence to cause depolarization at 2695 MHz.
Key words: polarization / methods: observational / ISM: magnetic fields / ISM: supernova remnants
© The Authors 2025
 Open Access article, published by EDP Sciences, under the terms of the Creative Commons Attribution License (https://creativecommons.org/licenses/by/4.0), which permits unrestricted use, distribution, and reproduction in any medium, provided the original work is properly cited.
This article is published in open access under the Subscribe to Open model. This email address is being protected from spambots. You need JavaScript enabled to view it. to support open access publication.
1 Introduction
Supernova remnants (SNRs) accelerate relativistic particles up to 1015 eV through a diffuse shock acceleration (DSA) mechanism (Blandford & Eichler 1987; LHAASO Collaboration 2021). The accelerated particles escape into the Galactic interstellar medium, making it an important Galactic cosmic ray (GCR) source (Blasi 2013). Radio observations measure the synchrotron emission from accelerated relativistic electrons. The polarization observations directly detect the magnetic field of the remnant in the sky plane. Multifrequency observations enable us to obtain the rotation measures (RMs) through polarization angle, ψ, variation (ψ = ψ0 + RM λ2) and derive the magnetic field along the line-of-sight to construct a three-dimensional configuration of the magnetic field. This is important for understanding the acceleration, diffusion, and evolution of relativistic particles in SNRs.
HB 9 (G160.9+2.6) is a large shell-type SNR with filamentary structures that has been mapped from radio to high-energy Fermi γ-ray bands (Kothes et al. 2006; Leahy & Tian 2007; Gao et al. 2011; Araya 2014; Saito et al. 2020). Its age was estimated to be 4000–7000 yr (Leahy et al. 2020). The distance of the SNR is obtained as 0.54±0.10 kpc from the optical extinction of background stars (Zhao et al. 2020), which is consistent with the kinematic distance of 0.6 ± 0.3 kpc estimated from the associated HI shell by Sezer et al. (2019). The pulsar PSR B0458+46 in the center of HB 9 is excluded from an association with the SNR by a lower limit distance of 2.7 kpc set by HI absorption (Jing et al. 2023), which leaves the outside magnetar SGR 0501+4516 (Göğüş et al. 2010) as possibly related. It is classified as mixed-morphology (MM) SNR with thermal X-ray emission in the center (Leahy & Aschenbach 1995). The γ-ray spectrum is explained by emission from inverse Compton (IC) scattering of electrons with a simple power-law energy spectrum with an index of two and a maximum electron energy of 500 GeV (Araya 2014). The magnetic field has been estimated to be 3–8 μG from the spectral energy distribution (SED) fitting (Zeng et al. 2019; Suzuki et al. 2022). Accelerated protons and electrons have escaped from the SNR, and interacted with two nearby molecular clouds to produce significant γ-ray emission (Oka & Ishizaki 2022).
The radio spectral index (S ~ να) varies from α = −0.57 to −0.64 for frequencies from 408 to 4800 MHz (Reich et al. 2003; Kothes et al. 2006; Gao et al. 2011), with steeper spectra in the interior regions than the filaments of the rim (Leahy & Tian 2007). The polarized emission of HB 9 has been previously observed at 21 cm, 11 cm, and 6 cm with the 100-m Effelsberg telescope (Fürst & Reich 2004) to find the intrinsic magnetic field configuration within the SNR. New Urumqi 6-cm polarization observations have improved the signal-to-noise ratio and revealed that the magnetic field mainly runs along the shell (Gao et al. 2011).
In this paper, we present a new polarization observation of HB 9 at 21 cm with the Five-hundred-meter Aperture Spherical Radio Telescope (FAST). FAST has the advantage of a large aperture with high resolution and high sensitivity (Jiang et al. 2020), and is equipped with a 19-beam wideband multichannel polarization receiver from 1050–1450 MHz to determine the rotation measures directly. It enables us to check whether the 21-cm polarized emission comes from the same distance as at shorter wavelengths. In combination with polarization observations at 11 cm and 6 cm, we analyze the polarization properties and determine the rotation measures to estimate the strength of the magnetic field within the remnant.
The paper is organized as follows. The observation and data reduction are described in Sect. 2. The decomposition of filaments and diffuse emission and spectral-index analysis is shown in Sect. 3.1. The polarization properties at 1385, 2695, and 4800 MHz are described in Sect. 3.2. The rotation-measure and depolarization analyses are presented in Sects. 3.3 and 3.4. In Sect. 4, we discuss the random magnetic field in the northern shell and depolarization associated with a foreground molecular cloud. Conclusions are summarized in Sect. 5.
2 Data
2.1 FAST 21-cm observations and data reduction
The FAST continuum mapping of HB 9 was observed in October 2023 in the multibeam “on-the-fly” mode using the 19-beam L-band receiver. It was scanned along the RA and Dec direction centering at α2000 = 5h01m0.0s, δ2000=46°39′0.0″, with a size of 5.0° × 3.6°. We observed 3 C 138 as calibrator. The spectral backend with 65536 channels covering the 1000–1500 MHz band recorded the four polarization outputs, including left-hand and right-hand total intensity I1 and I2, and Stokes U and V. The Stokes parameters were then calculated as I = I1 + I2, Q = I1 − I2, U and V. Each channel has a bandwidth of 7.6 kHz. A noise signal with an amplitude of 10 K was injected every two seconds to calibrate the intensity in the unit of antenna temperature (Ta in kelvin). The polarization leakage caused by the mismatch of the amplitudes and phases between the gains of the two linear feeds has been corrected using the injected reference signal. A radio-frequency-interference (RFI) zone caused by communication satellites and navigation satellites (1160–1280 MHz) was flagged, which separates the data into two subbands: subband1, centered at 1085 MHz, and subband2, at 1385 MHz.
The data reduction can be summarized as follows. First, we made a baseline correction to subtract the large-scale emission by linearly fitting two ends of each scan. Then, we converted the data to the main-beam brightness temperature (Tb in kelvin) and divided by the main beam efficiency (ηb) calculated from the calibrator (Sun et al. 2021). Finally, we weaved the data along the RA and Dec direction to destripe the scanning effects in the Fourier domain (Emerson & Gräve 1988). Each channel map was smoothed to a common angular resolution of 4′. Then they were binned every 20 channels to improve the noise level.
We averaged the data over the full FAST band by taking medians of all the frequency channels to form the combined Stokes I map. For the Q and U maps, we only used the subband2 1385 MHz data, which have a better signal-to-noise ratio. The polarized intensity, PI, corrected from the positive noise bias was calculated as ![Mathematical equation: $\[P I=\sqrt{Q^{2}+U^{2}-(1.2 \sigma)^{2}}\]$](/articles/aa/full_html/2025/05/aa53261-24/aa53261-24-eq1.png) (Wardle & Kronberg 1974), where the rms noise, σ, measured from the average combined ‘Q and U’ maps was about 4 mK. The polarization angle, ψ, was derived as being
(Wardle & Kronberg 1974), where the rms noise, σ, measured from the average combined ‘Q and U’ maps was about 4 mK. The polarization angle, ψ, was derived as being ![Mathematical equation: $\[\psi=\frac{1}{2} ~\arctan~ \frac{U}{Q}\]$](/articles/aa/full_html/2025/05/aa53261-24/aa53261-24-eq2.png) .
.
The FAST averaged subband 2 total-intensity and polarization maps of HB 9 at 1385 MHz are presented in Fig. 1. The shell and the filamentary structures are clearly identified. Polarization emission has been detected in the eastern filamentary shell, the diffuse end of the northern shell, and the diffuse end of the inner filamentary shell at a similar level of 160 mK Tb. The FAST 1385-MHz polarization-emission morphology is similar compared with the Dominion Radio Astrophysical Observatory (DRAO) 1420-MHz polarization-intensity map (Kothes et al. 2006), except that no weak polarization emission was detected in the southern filamentary shell region. This is reasonable as the DRAO synthesis map has a high angular resolution of ~1′, which suffers less beam depolarization.
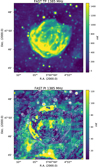 |
Fig. 1 Top panel: FAST total-intensity map of HB 9 of subband2 at a central frequency of 1385 MHz. The angular resolution is 4′. Bottom panel: FAST subband2 polarized-intensity map of HB 9 at 1385 MHz. Contours show the total intensities of HB 9 at 150, 400, 700, and 1100 mK and further increase in steps of 500 mK. |
2.2 Effelsberg 2695-MHz and Urumqi 4800-MHz maps
The archival total-intensity and polarization maps of HB 9 at 2695 MHz were observed with the Effelsberg 100-m telescope during test observations for the Effelsberg Galactic plane survey (Reich et al. 1984), where observation methods and data reduction were described. The angular resolution is 4.3′. The 2695-MHz map was already used for a RM study of HB 9 using Effelsberg 1420-MHz polarization data as second frequency (Fürst & Reich 2004). The data at 4800 MHz were from the “Sino-German” λ6 cm polarization survey of the Galactic plane (Gao et al. 2010). The angular resolution is about 9.75′. It is publicly available in the “Survey Sampler” of the Max-Plank-Institut für Radioastronomie1. Considering a shock velocity of 300 km s−1 in the Sedov phase deduced from the maximum velocity observed in the Hα line (Li et al. 2024), HB 9 will expand less than 5″ in 40 yr, which is relatively static at an angular resolution of 4.3′. It is not a restriction when compared with the recent FAST map.
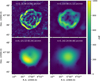 |
Fig. 2 Component images from the constrained diffusion decomposition (CDD) of HB 9 at the FAST subband at 1085 MHz. The color scale extends from 0 to 1.0 K Tb. The component number n and the corresponding range of the angular scales are marked in each panel. For component n<2, the angular scale is less than the beam size, and the emission is weak and therefore is not shown. |
2.3 CO data for comparison
We used the 12CO(J=1–0) data from Zhou et al. (2023) to check the molecular cloud environment around HB 9, which were obtained from the Milky Way Image Scroll Painting (MWISP)–CO line survey project using the Purple Mountain Observatory Delingha 13.7 m millimeter wavelength telescope. The angular resolution is ~51″, and the data were meshed with a grid spacing of 30″. The typical rms noise level is about 0.5 K at a spectral resolution of 0.16 km s−1. We integrated the 12CO (J=1–0) emission in the velocity ranges of [−10.0, +2.0] km s−1 and [−11.5, −10.0] km s−1, respectively, and compare it with the FAST 1385-MHz data in Sect. 4.1.
3 Results
3.1 Spectral index in the filament and diffuse emission
We applied the constrained diffusion decomposition (CDD) method (Li 2022) to decompose the total-intensity image of Fig. 1 into components of multiple angular scales. The CDD method improves the image smoothing quality by solving a modified, nonlinear version of the diffusion equation, and does not produce artifacts around regions with sharp transitions. The component images are shown in Fig. 2. For component n, the corresponding scale of the structures is larger than 2nΔ but smaller than 2n+1Δ, where Δ = 1.32′ is the grid size of the map. The bright filamentary shell structures are predominantly visible in components n=2 and n=3. For component n<2, the angular scale is less than the beam size, and the emission is very weak. Hence, these components are not shown.
We made temperature versus temperature plots (TT-plots) to determine the brightness temperature spectral index, β, defined as Tν ~ νβ. We derived β from the data’s slope (νy/νx)β, and the error was estimated by fitting the data twice, taking the two wavelengths as the independent variable individually. This method is less affected by the uncertainty of the base levels at these two frequencies. The flux-density spectral index, α, defined as Sν ~ να with Sν being the flux density, can then be obtained as α = β + 2. We used the two averaged subband data at 1085 MHz and 1385 MHz to derive TT-plots for different components of n > 2 (to avoid beam averaging). The point-like sources have been subtracted from the map and the results are shown in Fig. 3. The filamentary and diffuse emission of the SNR show different spectral indices.
The spectral indices of the filamentary emission of n=3 components are around α ~ −0.52, which is the standard DSA theory (Blandford & Ostriker 1978) expected for freshly accelerated relativistic electrons by the shock in the filaments. The spectral indices of the diffuse emission of components n=4 and n=5 with angular scales larger than 21′ are α ~ −0.63. This trend is similar to the result found by Leahy & Tian (2007). The accelerated energetic particles have escaped away from the remnant. The spectrum of confined particles in the diffuse emission, which are no longer accelerated, becomes steeper (Suzuki et al. 2022).
 |
Fig. 3 Temperature versus temperature plots (TT-plots) between FAST 1085-MHz and 1385-MHz subbands for total-intensity components at n = 3 to n = 5. These were derived from the data’s slope (νy/νx)β, and the error was estimated by fitting the data twice, taking the two wavelengths as the independent variable individually. |
3.2 Polarization maps at 1385, 2695, and 4800 MHz
As shown in the FAST 1385-MHz map in Fig. 1, polarization emission from the bright filaments in each shell is depolarized, which indicates that the observed polarization emission at 1385 MHz might come from a thin layer in the outer envelope of the shell, and cannot be used for the RM calculation with 2695-MHz and 4800-MHz data. In the diffuse end of the northern shell, there is also a depolarized zone (discussed in detail in Sect. 4.2).
The Effelsberg polarized-intensity map of HB 9 at 2695 MHz and the Urumqi polarized-intensity map at 4800 MHz are presented in Fig. 4. The polarized intensity at 2695 MHz corresponds well to that at 4800 MHz, with strong polarized emission confined to the outer and inner filamentary shock shells. They are distinct at different sections (labeled E, NE, N, and S). The polarization angle at 4800 MHz mainly runs parallel along the shock shell, which indicates the evolved properties of HB 9. The polarization percentage, PC, at 4800 MHz in the northeastern and northern shell region is about 20–40%, ~22% in the eastern region, ~24% in the southern region, and a lower value in the central region.
Assuming that the depolarization is the least at 4800 MHz and using PI4800 as reference, we can check the depolarization properties at 2695 MHz by calculating the relative polarization-percentage map interpreted as the depolarization factor of DP2695 = PC2695/PC4800. If there is no depolarization, DP2695 would be around 1. The result is depicted in the lower left panel of Fig. 4. The depolarization factor is around 1 for all areas except for the northeastern and northern shells, where DP2695 varies from about 0.6 to about 0.7, which indicates depolarization toward this region.
3.3 Rotation measure determination
3.3.1 RM-synthesis result of 1385-MHz data
We applied the RM-synthesis method to the FAST frequency cubes of Q and U of HB 9 to reconstruct the Faraday-depth spectrum (Brentjens & de Bruyn 2005). The method is based on the fact that the observed polarized intensity P(λ2) and the Faraday dispersion function F(ϕ) are Fourier transform pairs (Burn 1966),
![Mathematical equation: $\[P\left(\lambda^2\right)=Q\left(\lambda^2\right)+i U\left(\lambda^2\right)=\int F(\phi) e^{2 i \phi \lambda^2} d \phi,\]$](/articles/aa/full_html/2025/05/aa53261-24/aa53261-24-eq3.png) (1)
(1)
where λ is the wavelength and ϕ is the Faraday depth defined as ϕ = 0.812 ∫ neB||dr, with the thermal electron density ne in cm−3, the magnetic field along the line-of-sight B|| in μG, and the differential of the path length from the source to the observer dr in parsec.
The algorithm is applied for each pixel using the RM-Tools package (Purcell et al. 2020) adopting a Faraday-depth step interval of 4 rad m−2. For the subband2 frequency range and sampling, the width of the RM spread function is about 280 rad m−2. It returns the peak Faraday depth ϕpeak, which is equivalent to the rotation measure in rad m−2, and the maximum polarized intensity F(ϕpeak) (maxPI) at the peak Faraday depth.
We display the maxPI map and peak Faraday depth ϕpeak map toward HB 9 in Fig. 5. The polarized intensities in the maxPI map are nearly identical to the value directly obtained from the averaged Q and U in the lower panel of Fig. 1, which indicates that bandwidth depolarization is negligible during averaging. Most of the Faraday spectra show a single peak with only one emitting component, as also shown by the example spectra presented in Sun et al. (2021). The peak RM in the eastern shell, the northern shell, and the inner region varies from 4 to 28 rad m−2. The RM contribution from the foreground interstellar medium can be neglected. Toward the direction of HB 9, the large-scale magnetic field component parallel to the line-of-sight B|| is close to 0 as it runs along the spiral arm. If we assume an electron density of ne ~ 0.02 cm−3 and a magnetic field strength of 2 μG as typical values for the local interstellar medium, the foreground RM would be less than 2 rad m−2 at a distance of 540 pc.
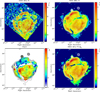 |
Fig. 4 Upper panels: Effelsberg 2695-MHz and Urumqi 4800-MHz polarized-intensity map of HB 9, overlaid with bars indicating B vectors (polarization angle +90° in case of negligible Faraday rotation). The contours in the left panel show the total intensity at 2695 MHz, starting at 100 mK in steps of 60 mK. The contours in the right panel show the total intensity at 4800 MHz (right), starting at 15 mK in steps of 8 mK. Lower panels: depolarization factor map at 2695 MHz of HB 9 (left), derived from the polarization percentage maps at 2695 and 4800 MHz (PC2695/PC4800). Values ≥ 1 mean no depolarization. A value of 0 means complete depolarization. The white areas are low-polarized intensity regions excluded from the depolarization calculation. The right panel shows the Urumqi 4800-MHz polarized intensity map of HB 9 with overlaid bars that show the intrinsic orientation of the transverse magnetic field. |
3.3.2 RMs between 2695 MHz and 4800 MHz
We used the conventional method to calculate the RM from the polarization angle variation caused by Faraday rotation at different wavelengths, λ. Observed RMs correspond to the Faraday depth, ϕ. Positive or negative RMs mean that the magnetic field is pointing towards or away from the observer.
The RM calculated from data at 4800 MHz and 2695 MHz is ![Mathematical equation: $\[\text{RM}=\frac{\psi_{2}-\psi_{1}}{\lambda_{2}^{2}-\lambda_{1}^{2}}\]$](/articles/aa/full_html/2025/05/aa53261-24/aa53261-24-eq4.png) , where the subscripts 1 and 2 stand for quantities at these two wavelengths, respectively. There is a nπ ambiguity of polarization angles, which results in a RM ambiguity of
, where the subscripts 1 and 2 stand for quantities at these two wavelengths, respectively. There is a nπ ambiguity of polarization angles, which results in a RM ambiguity of ![Mathematical equation: $\[n \pi /\left(\lambda_{2}^{2}-\lambda_{1}^{2}\right) \sim 370 ~\mathrm{rad} ~\mathrm{m}^{-2}, n=0, \pm 1, \pm 2,\]$](/articles/aa/full_html/2025/05/aa53261-24/aa53261-24-eq5.png) .... We smoothed the 2695-MHz U and Q maps to the same angular resolution of 9.75′ at 4800 MHz and calculated the PI map. The RMs were obtained for each pixel from all maps, except those with a polarized intensity less than the 5σ level, which is about 50 mK at 2695 MHz and 1.5 mK at 4800 MHz. The minimal RMs map of HB 9 is presented in Fig. 6. The RM in the eastern shell is about 70 rad m−2 (E), and the northern shells have similar RMs of about 70–80 rad m−2 (NW), while the northeastern shell has a value of 60–70 rad m−2. The inner southern shell (S) has an RM of 124 rad m−2. The intrinsic polarization angles, ψ0, determined based on RMs are shown in the lower right panel of Fig. 4. The intrinsic perpendicular magnetic field aligns well along the shell in the E, NE, and N region.
.... We smoothed the 2695-MHz U and Q maps to the same angular resolution of 9.75′ at 4800 MHz and calculated the PI map. The RMs were obtained for each pixel from all maps, except those with a polarized intensity less than the 5σ level, which is about 50 mK at 2695 MHz and 1.5 mK at 4800 MHz. The minimal RMs map of HB 9 is presented in Fig. 6. The RM in the eastern shell is about 70 rad m−2 (E), and the northern shells have similar RMs of about 70–80 rad m−2 (NW), while the northeastern shell has a value of 60–70 rad m−2. The inner southern shell (S) has an RM of 124 rad m−2. The intrinsic polarization angles, ψ0, determined based on RMs are shown in the lower right panel of Fig. 4. The intrinsic perpendicular magnetic field aligns well along the shell in the E, NE, and N region.
According to the simulation of a spherical SNR expanding into an ambient medium of constant density and homogeneous magnetic field (Kothes & Brown 2009), the RM values on both shells have almost the same value. For the inner southern shell of HB 9, the RM (n= −1) of −240 rad m−2 could be excluded. Larger RM values (n= 1) are also impossible considering the physical conditions in the shell.
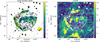 |
Fig. 5 RM (left panel) and maximum polarized intensity (right panel) of HB 9 at 1240 MHz derived from the RM synthesis method. The contours show the subband 2 total intensity at 1385 MHz, starting at 500 mK in steps of 400 mK. |
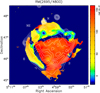 |
Fig. 6 RM map of HB 9 calculated from the 2695-MHz and 4800-MHz maps. The contours show the total intensity at 4800 MHz, starting at 15 mK in steps of 8 mK. The eastern and northern shells have RMs of 80 rad m−2, while the inner and southern shells have RMs of 124 rad m−2. |
3.4 Depolarization analysis
The northeastern and northern shells show a depolarization factor between 2695 MHz and 4800 MHz of 0.6–0.7, while the other regions have a value of 1 (bottom left image in Fig. 4). We considered the possible depolarization mechanism there. According to Sokoloff et al. (1998), two main depolarization mechanisms may cause depolarization for the synchrotron emitting region. One is depth depolarization, caused by thermal gas co-existing with the synchrotron emitting region. The other is beam depolarization caused by RM fluctuations (δRM) within the beamsize of the telescope in front of the synchrotron-emission medium. As the other shells with similar or larger observed rotation measures show no depolarization at 2695 MHz, we considered beam depolarization as the main depolarization mechanism in the northeastern and northern shells.
The depolarization factor of beam depolarization can be written as ![Mathematical equation: $\[D P_{\nu}=exp \left[-2 \delta_{R M}^{2}\left(\lambda^{4}-\lambda_{0}^{4}\right)\right]\]$](/articles/aa/full_html/2025/05/aa53261-24/aa53261-24-eq6.png) (Sokoloff et al. 1998). The values of DP2695 yield RM fluctuations from ~36 rad m−2 to ~43 rad m−2. The RM fluctuation at these levels will cause virtually complete depolarization at 1385 MHz. We noticed that the northeastern and northern shells were in contact with a molecular cloud (Sect. 4.1). It is possible that shock waves have entered the dense gas environment in these regions, and have driven turbulence and caused the RM dispersion to result in depolarization.
(Sokoloff et al. 1998). The values of DP2695 yield RM fluctuations from ~36 rad m−2 to ~43 rad m−2. The RM fluctuation at these levels will cause virtually complete depolarization at 1385 MHz. We noticed that the northeastern and northern shells were in contact with a molecular cloud (Sect. 4.1). It is possible that shock waves have entered the dense gas environment in these regions, and have driven turbulence and caused the RM dispersion to result in depolarization.
3.5 Regular and random B strength
From the Hα map shown in Fig. 7 (Finkbeiner 2003), the Hα intensity is about 18 Rayleigh toward the southeastern shell. Following Haffner et al. (1998) and neglecting absorption, the emission measure (EM) can be derived as ![Mathematical equation: $\[E M=2.75 T_{4}^{0.9} I_{H_{\alpha}}\]$](/articles/aa/full_html/2025/05/aa53261-24/aa53261-24-eq7.png) . Here EM is in pc cm−6, the electron temperature, T4, is in 104 K, and IHα is in Rayleigh. Taking the typical value of T4 = 0.8, we obtained an EM of 40 pc cm−6. The width of the filamentary shell is about 5′, which corresponds to 0.8 pc (adopting the distance of 540 pc), and the path length along the line-of-sight, l, is about 7.5 pc. The thermal electron density, ne, can be derived according to
. Here EM is in pc cm−6, the electron temperature, T4, is in 104 K, and IHα is in Rayleigh. Taking the typical value of T4 = 0.8, we obtained an EM of 40 pc cm−6. The width of the filamentary shell is about 5′, which corresponds to 0.8 pc (adopting the distance of 540 pc), and the path length along the line-of-sight, l, is about 7.5 pc. The thermal electron density, ne, can be derived according to ![Mathematical equation: $\[E M \sim n_{e}^{2} l\]$](/articles/aa/full_html/2025/05/aa53261-24/aa53261-24-eq8.png) , which is about 2.3 cm−3 in the eastern shell. Here the volume filling factor for the thermal electrons is assumed to be 1. The optical [SII] 6716/6730 line ratio shows ne variations from the inner to outer eastern shell (Li et al. 2024).
, which is about 2.3 cm−3 in the eastern shell. Here the volume filling factor for the thermal electrons is assumed to be 1. The optical [SII] 6716/6730 line ratio shows ne variations from the inner to outer eastern shell (Li et al. 2024).
The Hα intensities in the northern, inner shell are about 10 and 22 Rayleigh, which correspond to an EM of 22 and 50 pc cm−6, respectively, and an electron density of 1.7 and 2.6 cm−3 assuming a similar path length of the shell. The average RM derived from the data at 2695 MHz and 4800 MHz is about 70 rad m−2 toward the eastern and northern shell, without foreground contributions. The regular magnetic field there can then be estimated to be about 5.0 and 6.8 μG. With RM of 124 rad m−2 in the inner shell region, the regular magnetic field there is about 7.6 μG. This estimate largely depends on the geometry path length of the shell, with a relation of ![Mathematical equation: $\[B_{\|}=\frac{R M}{0.81 n_{e} l}= \frac{R M}{0.81 ~\sqrt{E M ~l}} \sim l^{-0.5}\]$](/articles/aa/full_html/2025/05/aa53261-24/aa53261-24-eq9.png) . Zeng et al. (2019) modeled the SED spectrum of HB 9 from the radio to γ-ray bands, and obtained a magnetic field of about 3 μG for the whole SNR. Oka & Ishizaki (2022) fitted a magnetic field of 8 μG from the Fermi-LAT γ-ray emission spectra around HB 9. Our results are more inclined toward the latter, which only considers the IC process and has fewer model parameters, which indicates that the leptonic process dominates HB 9.
. Zeng et al. (2019) modeled the SED spectrum of HB 9 from the radio to γ-ray bands, and obtained a magnetic field of about 3 μG for the whole SNR. Oka & Ishizaki (2022) fitted a magnetic field of 8 μG from the Fermi-LAT γ-ray emission spectra around HB 9. Our results are more inclined toward the latter, which only considers the IC process and has fewer model parameters, which indicates that the leptonic process dominates HB 9.
The RM fluctuation toward the northern shell can be interpreted as ![Mathematical equation: $\[\delta R M \sim 0.81 n_{e} b ~\sqrt{L l}\]$](/articles/aa/full_html/2025/05/aa53261-24/aa53261-24-eq10.png) (Sun et al. 2011), where b represents the strength of the random magnetic field in μG, and L is the correlation scale for magnetic field fluctuations in parsec. For beam depolarization, L should be much smaller than the beam width of 4′ or 0.6 pc. The path length along the line-of-sight, l, is similar to the eastern shell, 7.5 pc. The lower limit of b is about 12 μG, larger than the regular magnetic fields.
(Sun et al. 2011), where b represents the strength of the random magnetic field in μG, and L is the correlation scale for magnetic field fluctuations in parsec. For beam depolarization, L should be much smaller than the beam width of 4′ or 0.6 pc. The path length along the line-of-sight, l, is similar to the eastern shell, 7.5 pc. The lower limit of b is about 12 μG, larger than the regular magnetic fields.
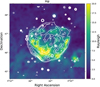 |
Fig. 7 Hα map of HB 9 (Finkbeiner 2003). The overlaid contours show the FAST subband 2 total intensity at 1385 MHz, starting at 500 mK in steps of 400 mK. |
4 Discussion
As shown by Sezer et al. (2019), HB 9 is expanding into dense CO and HI material in the northeastern, eastern and southern sides. The ambient gas environment affects the magnetic field and polarization properties of SNRs. The enhanced regular magnetic field in the CO and HI structures can make them act as Faraday screens to cause depolarization (Wolleben & Reich 2004; Xiao et al. 2023). In this section, we compare the radio map with new CO data obtained by the MWISP survey to discuss the random magnetic field in the northern shell of HB 9 and to analyze the depolarization void in the northern shell. We present CO maps in the velocity range of −10.0 to +2.0 km s−1 (left panel) and −11.5 to −10.0 km s−1 (right panel) in Fig. 8, with the FAST 1385 MHz emission of HB 9 overlaid as contours.
4.1 Turbulence in the northern shell
From the integrated broad velocity intervals [−10.0 to +2.0] km s−1 map of the MWISP CO data in the left panel of Fig. 8, we can see that the northeastern shell of HB 9 is adjacent to the tail of the eastern CO cloud. An enhanced dense HI gas well follows the northeastern shell in Fig. 4 of Sezer et al. (2019). Although no broadened CO line profile was found, this indicates that the shock wave is expanding into a dense gas environment.
When a shock encounters a density enhancement, the shock changes from nonradiative to radiative. Thermal instabilities can develop in shocks faster than about 120 km s−1 (Innes et al. 1987). Any density inhomogeneities in the upstream gas can generate velocity shear and vorticity, which create small-scale turbulence that winds up and amplifies the magnetic field (Giacalone & Jokipii 2007; Guo et al. 2012). It will cause a disordered magnetic field and reduce the degree of polarization of radio synchrotron emission.
A similar turbulence has been reported in the eastern and western shell of Cygnus Loop, where the remnant drives a 100–150 km s−1 radiative shock into high-density clouds (Raymond et al. 2020). It leads to a full depolarization at 21 cm, and a random magnetic field lower limit of 5 μG toward the northeastern part and 3 μG towards the western part (Sun et al. 2022). For HB 9, the shock has possibly entered the dense gas environment in the northeastern shell and driven the turbulence magnetic field, which caused the depolarization at 2695 MHz.
4.2 Depolarization feature associated with the molecular cloud
The depolarization feature in the northern filamentary shell at RA~5h01m, Dec~47°33′ coincides with a spherical CO cloud at −11.5 to −10.0 km s−1 (orange box in the right panel of Fig. 8) with a width of 10′. Considering a cylinder shape, the physical size of the CO cloud is of the order of 1.6 pc for the distance of HB 9 of 540 pc. There are also depolarization structures revealed in the same region of the DRAO 1420 MHz map (Kothes et al. 2006).
It has been reported that the surface of the local molecular clouds act as magneto-ionic Faraday screens to cause depolarization at 21 cm by rotating background emission, which adds to foreground emission in a different way than the surroundings (Wolleben & Reich 2004). Fleishman & Tokarev (1995) showed that the local synchrotron emissivity has a strong linear variation with distance. Several Faraday-screen modeling works have found local emissivities at 1.4 GHz of 1.7K/kpc (Wolleben & Reich 2004), 0.94 K/kpc or 0.70 K/kpc for G107.0+9.0, depending on the distance (Reich et al. 2021), and 1.1 K/kpc for G203.7+11.5 (Reich et al. 2020). Adopting a typical emissivity of 1 K/kpc at 1.4 GHz toward local objects, the foreground emission in front of HB 9 (d~540 pc) is about 540 mK. This corresponds to polarized emission of about 160 mK for a 30% polarization, which is comparable to the emission toward the northern shock shell. Thus it is possible that the CO cloud has acted as a Faraday screen along its periphery. The background shell emission is rotated, and canceled after adding to foreground emission. The enhanced B field could come from the strong stellar wind of the progenitor star of HB 9, or the formation process of the molecular cloud. The enhanced electron density, ne, comes from the carbon and hydrogen in a thin outer layer in the cloud, which is photodissociated by the hydrogen-ionizing photons from the progenitor star and cosmic rays from the remnant.
We estimated the total electron density, ne, in the boundaries of the cloud in the following way. The excess reddening at the position of the CO cloud is EB–V ~ 0.8 mag (Schlegel et al. 1998). The total neutral-hydrogen density amounts to n(HI+H2) ~ 940 cm−3 for a size of the cloud of 1.6 pc, based on the gas-todust relation N(HI+H2)/EB–V = 5.8 × 1021 cm−2 mag−1 (Bohlin et al. 1978), where the N(HI+H2) is the total neutral-hydrogen column density. The C/H ratio in the cloud is related to the fractional abundances of molecular hydrogen, ![Mathematical equation: $\[f\left(H_{2}\right)=\frac{2 N_{H_{2}}}{N_{H I}+2 N_{H_{2}}}\]$](/articles/aa/full_html/2025/05/aa53261-24/aa53261-24-eq11.png) (Gnacinski 2000). For extinctions of AV ~ 3.1 EB–V ~ 2.48 mag, the photodissociation region (PDR) model of Hollenbach et al. (1991) gives f(H2) > 10−3, which corresponds to a C/H ratio of 1.36×10⁻⁴. The local electron density from the complete ionization of carbon will contribute an enhancement of about 0.13 cm−3. As the UV photons from the progenitor star and the cosmic ray escaping from the shock wave finally ionize the cloud and generate thermal electrons, it is possible to consider that both the hydrogen and carbon are ionized to contribute to a total electron density of
(Gnacinski 2000). For extinctions of AV ~ 3.1 EB–V ~ 2.48 mag, the photodissociation region (PDR) model of Hollenbach et al. (1991) gives f(H2) > 10−3, which corresponds to a C/H ratio of 1.36×10⁻⁴. The local electron density from the complete ionization of carbon will contribute an enhancement of about 0.13 cm−3. As the UV photons from the progenitor star and the cosmic ray escaping from the shock wave finally ionize the cloud and generate thermal electrons, it is possible to consider that both the hydrogen and carbon are ionized to contribute to a total electron density of ![Mathematical equation: $\[n_{e} \sim \frac{n_{\mathrm{C}^{+}}}{C / H} f\left(H_{2}\right)+n_{\mathrm{C}^{+}} \sim 0.13 / 0.136\left(\mathrm{H}^{+}\right)+0.13\left(\mathrm{C}^{+}\right) \sim 1.09 \mathrm{~cm}^{-3}\]$](/articles/aa/full_html/2025/05/aa53261-24/aa53261-24-eq12.png) . With a filling factor of 1, the magnetic field strength in the thin layer of the cloud should be no less than 13 μG for the least intrinsic rotation measure of −18 rad m−2 required to have a depolarization effect in the model of Wolleben & Reich (2004).
. With a filling factor of 1, the magnetic field strength in the thin layer of the cloud should be no less than 13 μG for the least intrinsic rotation measure of −18 rad m−2 required to have a depolarization effect in the model of Wolleben & Reich (2004).
It has been observed that the stellar wind from the progenitor star of remnants has triggered star formation in ambient molecular clouds with young stellar objects (YSOs), such as IC 443 (Su et al. 2014). Although the CO cloud is not dense enough to form YSOs, its shape resembles the fragmentation of CO clouds after contact with the stellar wind of the progenitor star.
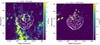 |
Fig. 8 CO map in the velocity range of −10.0 to +2.0 km s−1 (left) and −11.5 to −10.0 km s−1 (right) of HB 9. White contours show the subband 2 total intensity of HB 9 at 1385 MHz with point sources subtracted, starting at 400 mK in steps of 500 mK. Magenta contours show the subband 2 polarized intensity at 1385 MHz, starting at 100 mK in steps of 50 mK. The orange box marks the polarization void region at RA~5h01m, Dec~47°33′. |
5 Summary
We obtained new 21-cm continuum polarization cube data of the SNR HB 9 using the FAST radio telescope. We decomposed the total-intensity image into components of multiple angular scales. This showed that the filamentary emission has a spectrum with α = −0.52, which corresponds to the freshly accelerated relativistic electrons, and the diffuse emission has a steeper spectrum with α = −0.63, which corresponds to the confined electrons that are no longer accelerated.
Depolarization associated with bright filaments in each shell has been observed in the FAST data at 1385 MHz. The detected polarized emission might come from a thin layer in the outer envelope of the shells, with a Faraday depth of 4–28 rad m−2 from the Faraday rotation synthesis result. We reanalyzed the rotation measures of HB 9 using the Effelsberg 2695-MHz and Urumqi 4800-MHz data. The RM is about 70 rad m−2 in the eastern and northern shell, and 124 rad m−2 in the inner and southern patches. The regular magnetic field is estimated to be 5–8 μG over the remnant.
The northern shell shows depolarization at 2695 MHz, with a depolarization factor of 0.6–0.7 relative to the 4800-MHz polarization data. This can be explained by the beam depolarization with an δRM of 36–43 rad m−2, which indicates an additional random magnetic field of 12 μG on the scale of 0.6 pc. The shock might have entered the dense gas environment in the northern shell region and has driven turbulence to cause depolarization at 2695 MHz.
Acknowledgements
We thank the journal referee for critical reading and valuable comments to improve the paper. This work is supported by the Key Program of National Natural Science Foundation of China (12433006), and the Guizhou Provincial Science and Technology Projects (No. QKHFQ[2023]003, No. QKHFQ[2024]001, No. QKHPTRC-ZDSYS[2023]003). We acknowledge the help from FAST colleagues for using the server, and Dr. Li, J.T. for providing the MWISP CO data. This research made use of the data from the Milky Way Imaging Scroll Painting (MWISP) project, which is a multi-line survey in 12CO/13CO/C18O along the northern galactic plane with the PMO-13.7 m telescope. We are grateful to all the members of the MWISP working group, particularly the staff members at the PMO-13.7m telescope, for their long-term support. MWISP was sponsored by National Key R&D Programme of China with grants 2023YFA1608000 and 2017YFA0402701 and by CAS Key Research Programme of Frontier Sciences with grant QYZDJ-SSW-SLH047.
References
- Araya, M. 2014, MNRAS, 444, 860 [CrossRef] [Google Scholar]
- Blandford, R., & Eichler, D. 1987, Phys. Rep., 154, 1 [Google Scholar]
- Blandford, R. D., & Ostriker, J. P. 1978, ApJ, 221, L29 [Google Scholar]
- Blasi, P. 2013, A&A Rev., 21, 70 [NASA ADS] [CrossRef] [Google Scholar]
- Bohlin, R. C., Savage, B. D., & Drake, J. F. 1978, ApJ, 224, 132 [Google Scholar]
- Brentjens, M. A., & de Bruyn, A. G. 2005, A&A, 441, 1217 [NASA ADS] [CrossRef] [EDP Sciences] [Google Scholar]
- Burn, B. J. 1966, MNRAS, 133, 67 [Google Scholar]
- Emerson, D. T., & Gräve, R. 1988, A&A, 190, 353 [NASA ADS] [Google Scholar]
- Finkbeiner, D. P. 2003, ApJS, 146, 407 [Google Scholar]
- Fleishman, G. D., & Tokarev, Y. V. 1995, A&A, 293, 565 [Google Scholar]
- Fürst, E., & Reich, W. 2004, in The Magnetized Interstellar Medium, eds. B. Uyanıker, W. Reich, & R. Wielebinski, 141 [Google Scholar]
- Gao, X. Y., Reich, W., Han, J. L., et al. 2010, A&A, 515, A64 [NASA ADS] [CrossRef] [EDP Sciences] [Google Scholar]
- Gao, X. Y., Han, J. L., Reich, W., et al. 2011, A&A, 529, A159 [NASA ADS] [CrossRef] [EDP Sciences] [Google Scholar]
- Giacalone, J., & Jokipii, J. R. 2007, ApJ, 663, L41 [Google Scholar]
- Gnacinski, P. 2000, Acta Astron., 50, 133 [NASA ADS] [Google Scholar]
- Göğüş, E., Woods, P. M., Kouveliotou, C., et al. 2010, ApJ, 722, 899 [Google Scholar]
- Guo, F., Li, S., Li, H., et al. 2012, ApJ, 747, 98 [NASA ADS] [CrossRef] [Google Scholar]
- Haffner, L. M., Reynolds, R. J., & Tufte, S. L. 1998, ApJ, 501, L83 [NASA ADS] [CrossRef] [Google Scholar]
- Hollenbach, D. J., Takahashi, T., & Tielens, A. G. G. M. 1991, ApJ, 377, 192 [NASA ADS] [CrossRef] [Google Scholar]
- Innes, D. E., Giddings, J. R., & Falle, S. A. E. G. 1987, MNRAS, 226, 67 [Google Scholar]
- Jiang, P., Tang, N.-Y., Hou, L.-G., et al. 2020, RAA, 20, 064 [NASA ADS] [Google Scholar]
- Jing, W. C., Han, J. L., Hong, T., et al. 2023, MNRAS, 523, 4949 [NASA ADS] [CrossRef] [Google Scholar]
- Kothes, R., & Brown, J.-A. 2009, in Cosmic Magnetic Fields: From Planets, to Stars and Galaxies, 259, eds. K. G. Strassmeier, A. G. Kosovichev, & J. E. Beckman, 75 [Google Scholar]
- Kothes, R., Fedotov, K., Foster, T. J., & Uyanıker, B. 2006, A&A, 457, 1081 [CrossRef] [EDP Sciences] [Google Scholar]
- Leahy, D. A., & Aschenbach, B. 1995, A&A, 293, 853 [NASA ADS] [Google Scholar]
- Leahy, D. A., & Tian, W. W. 2007, A&A, 461, 1013 [NASA ADS] [CrossRef] [EDP Sciences] [Google Scholar]
- Leahy, D. A., Ranasinghe, S., & Gelowitz, M. 2020, ApJS, 248, 16 [NASA ADS] [CrossRef] [Google Scholar]
- LHAASO Collaboration (Cao, Z., et al.) 2021, Science, 373, 425 [Google Scholar]
- Li, G.-X. 2022, ApJS, 259, 59 [NASA ADS] [CrossRef] [Google Scholar]
- Li, J.-T., Lu, L.-Y., Mao, H., et al. 2024, A&A, 690, A42 [NASA ADS] [CrossRef] [EDP Sciences] [Google Scholar]
- Oka, T., & Ishizaki, W. 2022, PASJ, 74, 625 [CrossRef] [Google Scholar]
- Purcell, C. R., Van Eck, C. L., West, J., Sun, X. H., & Gaensler, B. M. 2020, RM-Tools: Rotation measure (RM) synthesis and Stokes QU-fitting, Astrophysics Source Code Library [record ascl:2005.003] [Google Scholar]
- Raymond, J. C., Slavin, J. D., Blair, W. P., et al. 2020, ApJ, 903, 2 [NASA ADS] [CrossRef] [Google Scholar]
- Reich, W., Fürst, E., Haslam, C. G. T., Steffen, P., & Reif, K. 1984, A&AS, 58, 197 [NASA ADS] [Google Scholar]
- Reich, W., Zhang, X., & Fürst, E. 2003, A&A, 408, 961 [NASA ADS] [CrossRef] [EDP Sciences] [Google Scholar]
- Reich, W., Reich, P., & Sun, X. 2020, A&A, 641, A121 [NASA ADS] [CrossRef] [EDP Sciences] [Google Scholar]
- Reich, W., Gao, X., & Reich, P. 2021, A&A, 655, A10 [NASA ADS] [CrossRef] [EDP Sciences] [Google Scholar]
- Saito, M., Yamauchi, S., Nobukawa, K. K., Bamba, A., & Pannuti, T. G. 2020, PASJ, 72, 65 [NASA ADS] [CrossRef] [Google Scholar]
- Schlegel, D. J., Finkbeiner, D. P., & Davis, M. 1998, ApJ, 500, 525 [Google Scholar]
- Sezer, A., Ergin, T., Yamazaki, R., Sano, H., & Fukui, Y. 2019, MNRAS, 489, 4300 [NASA ADS] [CrossRef] [Google Scholar]
- Sokoloff, D. D., Bykov, A. A., Shukurov, A., et al. 1998, MNRAS, 299, 189 [Google Scholar]
- Su, Y., Fang, M., Yang, J., Zhou, P., & Chen, Y. 2014, ApJ, 788, 122 [NASA ADS] [CrossRef] [Google Scholar]
- Sun, X. H., Reich, W., Han, J. L., et al. 2011, A&A, 527, A74 [NASA ADS] [CrossRef] [EDP Sciences] [Google Scholar]
- Sun, X. H., Meng, M. N., Gao, X. Y., et al. 2021, RAA, 21, 282 [Google Scholar]
- Sun, X. H., Gao, X. Y., Reich, W., et al. 2022, Res. Astron. Astrophys., 22, 125011 [Google Scholar]
- Suzuki, H., Bamba, A., Yamazaki, R., & Ohira, Y. 2022, ApJ, 924, 45 [NASA ADS] [CrossRef] [Google Scholar]
- Wardle, J. F. C., & Kronberg, P. P. 1974, ApJ, 194, 249 [Google Scholar]
- Wolleben, M., & Reich, W. 2004, A&A, 427, 537 [NASA ADS] [CrossRef] [EDP Sciences] [Google Scholar]
- Xiao, L., Zhu, M., Sun, X.-H., Jiang, P., & Sun, C. 2023, ApJ, 952, 94 [Google Scholar]
- Zeng, H., Xin, Y., & Liu, S. 2019, ApJ, 874, 50 [NASA ADS] [CrossRef] [Google Scholar]
- Zhao, H., Jiang, B., Li, J., et al. 2020, ApJ, 891, 137 [CrossRef] [Google Scholar]
- Zhou, X., Su, Y., Yang, J., et al. 2023, ApJS, 268, 61 [NASA ADS] [CrossRef] [Google Scholar]
All Figures
|
Fig. 1 Top panel: FAST total-intensity map of HB 9 of subband2 at a central frequency of 1385 MHz. The angular resolution is 4′. Bottom panel: FAST subband2 polarized-intensity map of HB 9 at 1385 MHz. Contours show the total intensities of HB 9 at 150, 400, 700, and 1100 mK and further increase in steps of 500 mK. |
| In the text | |
|
Fig. 2 Component images from the constrained diffusion decomposition (CDD) of HB 9 at the FAST subband at 1085 MHz. The color scale extends from 0 to 1.0 K Tb. The component number n and the corresponding range of the angular scales are marked in each panel. For component n<2, the angular scale is less than the beam size, and the emission is weak and therefore is not shown. |
| In the text | |
|
Fig. 3 Temperature versus temperature plots (TT-plots) between FAST 1085-MHz and 1385-MHz subbands for total-intensity components at n = 3 to n = 5. These were derived from the data’s slope (νy/νx)β, and the error was estimated by fitting the data twice, taking the two wavelengths as the independent variable individually. |
| In the text | |
|
Fig. 4 Upper panels: Effelsberg 2695-MHz and Urumqi 4800-MHz polarized-intensity map of HB 9, overlaid with bars indicating B vectors (polarization angle +90° in case of negligible Faraday rotation). The contours in the left panel show the total intensity at 2695 MHz, starting at 100 mK in steps of 60 mK. The contours in the right panel show the total intensity at 4800 MHz (right), starting at 15 mK in steps of 8 mK. Lower panels: depolarization factor map at 2695 MHz of HB 9 (left), derived from the polarization percentage maps at 2695 and 4800 MHz (PC2695/PC4800). Values ≥ 1 mean no depolarization. A value of 0 means complete depolarization. The white areas are low-polarized intensity regions excluded from the depolarization calculation. The right panel shows the Urumqi 4800-MHz polarized intensity map of HB 9 with overlaid bars that show the intrinsic orientation of the transverse magnetic field. |
| In the text | |
|
Fig. 5 RM (left panel) and maximum polarized intensity (right panel) of HB 9 at 1240 MHz derived from the RM synthesis method. The contours show the subband 2 total intensity at 1385 MHz, starting at 500 mK in steps of 400 mK. |
| In the text | |
|
Fig. 6 RM map of HB 9 calculated from the 2695-MHz and 4800-MHz maps. The contours show the total intensity at 4800 MHz, starting at 15 mK in steps of 8 mK. The eastern and northern shells have RMs of 80 rad m−2, while the inner and southern shells have RMs of 124 rad m−2. |
| In the text | |
|
Fig. 7 Hα map of HB 9 (Finkbeiner 2003). The overlaid contours show the FAST subband 2 total intensity at 1385 MHz, starting at 500 mK in steps of 400 mK. |
| In the text | |
|
Fig. 8 CO map in the velocity range of −10.0 to +2.0 km s−1 (left) and −11.5 to −10.0 km s−1 (right) of HB 9. White contours show the subband 2 total intensity of HB 9 at 1385 MHz with point sources subtracted, starting at 400 mK in steps of 500 mK. Magenta contours show the subband 2 polarized intensity at 1385 MHz, starting at 100 mK in steps of 50 mK. The orange box marks the polarization void region at RA~5h01m, Dec~47°33′. |
| In the text | |
Current usage metrics show cumulative count of Article Views (full-text article views including HTML views, PDF and ePub downloads, according to the available data) and Abstracts Views on Vision4Press platform.
Data correspond to usage on the plateform after 2015. The current usage metrics is available 48-96 hours after online publication and is updated daily on week days.
Initial download of the metrics may take a while.