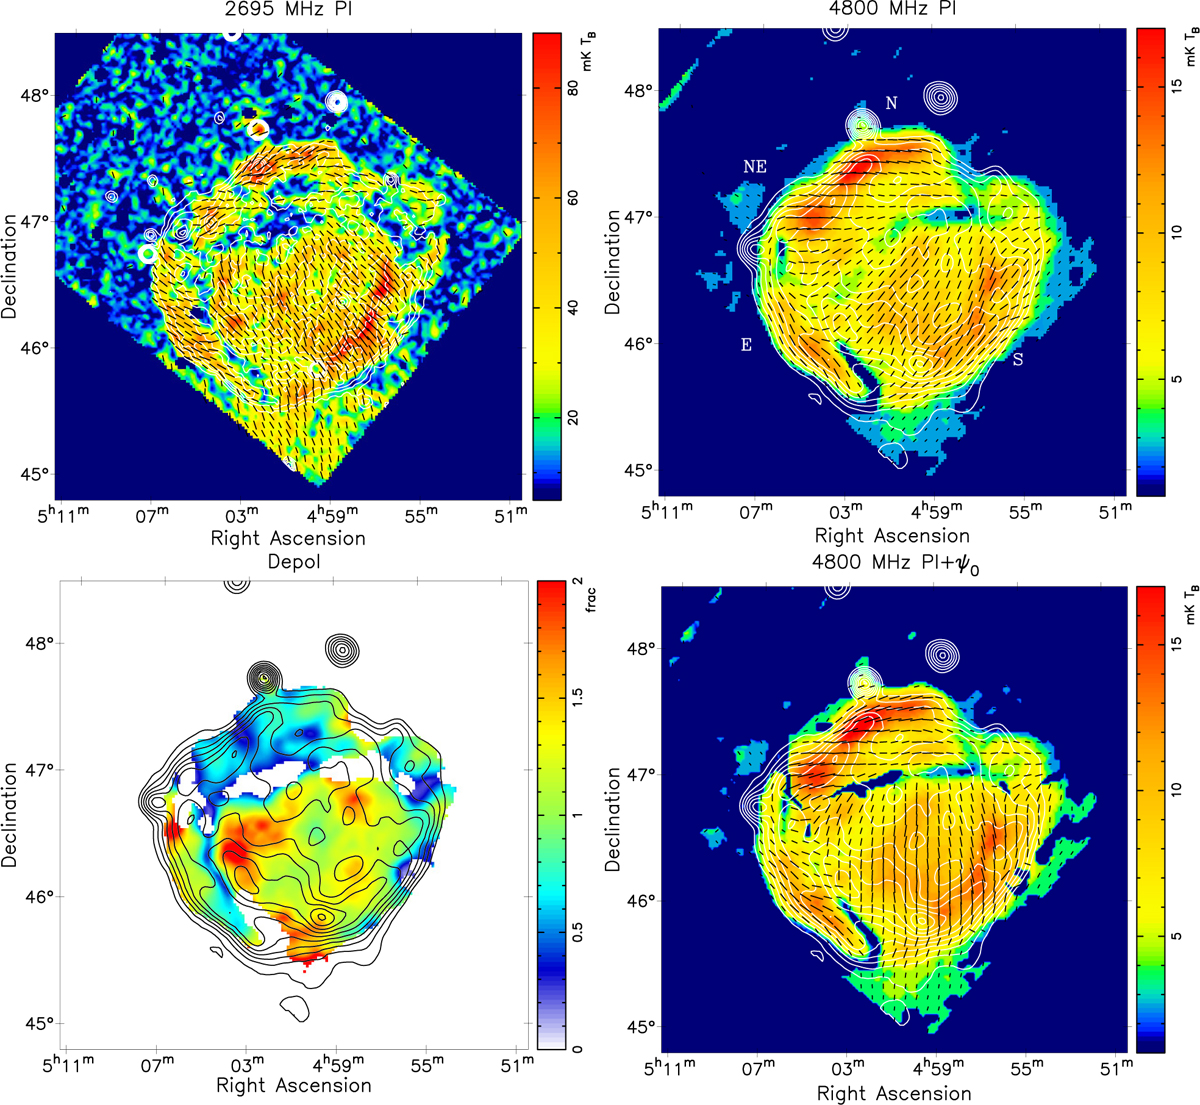
Fig. 4
Download original image
Upper panels: Effelsberg 2695-MHz and Urumqi 4800-MHz polarized-intensity map of HB 9, overlaid with bars indicating B vectors (polarization angle +90° in case of negligible Faraday rotation). The contours in the left panel show the total intensity at 2695 MHz, starting at 100 mK in steps of 60 mK. The contours in the right panel show the total intensity at 4800 MHz (right), starting at 15 mK in steps of 8 mK. Lower panels: depolarization factor map at 2695 MHz of HB 9 (left), derived from the polarization percentage maps at 2695 and 4800 MHz (PC2695/PC4800). Values ≥ 1 mean no depolarization. A value of 0 means complete depolarization. The white areas are low-polarized intensity regions excluded from the depolarization calculation. The right panel shows the Urumqi 4800-MHz polarized intensity map of HB 9 with overlaid bars that show the intrinsic orientation of the transverse magnetic field.
Current usage metrics show cumulative count of Article Views (full-text article views including HTML views, PDF and ePub downloads, according to the available data) and Abstracts Views on Vision4Press platform.
Data correspond to usage on the plateform after 2015. The current usage metrics is available 48-96 hours after online publication and is updated daily on week days.
Initial download of the metrics may take a while.