Open Access
Fig. 3
Download original image
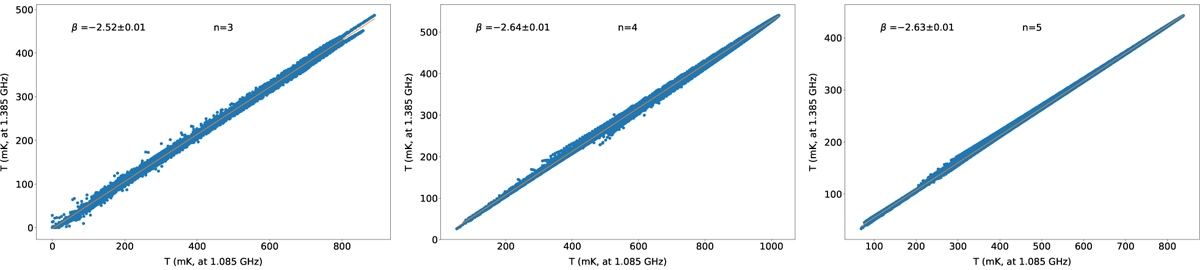
Temperature versus temperature plots (TT-plots) between FAST 1085-MHz and 1385-MHz subbands for total-intensity components at n = 3 to n = 5. These were derived from the data’s slope (νy/νx)β, and the error was estimated by fitting the data twice, taking the two wavelengths as the independent variable individually.
Current usage metrics show cumulative count of Article Views (full-text article views including HTML views, PDF and ePub downloads, according to the available data) and Abstracts Views on Vision4Press platform.
Data correspond to usage on the plateform after 2015. The current usage metrics is available 48-96 hours after online publication and is updated daily on week days.
Initial download of the metrics may take a while.