Open Access
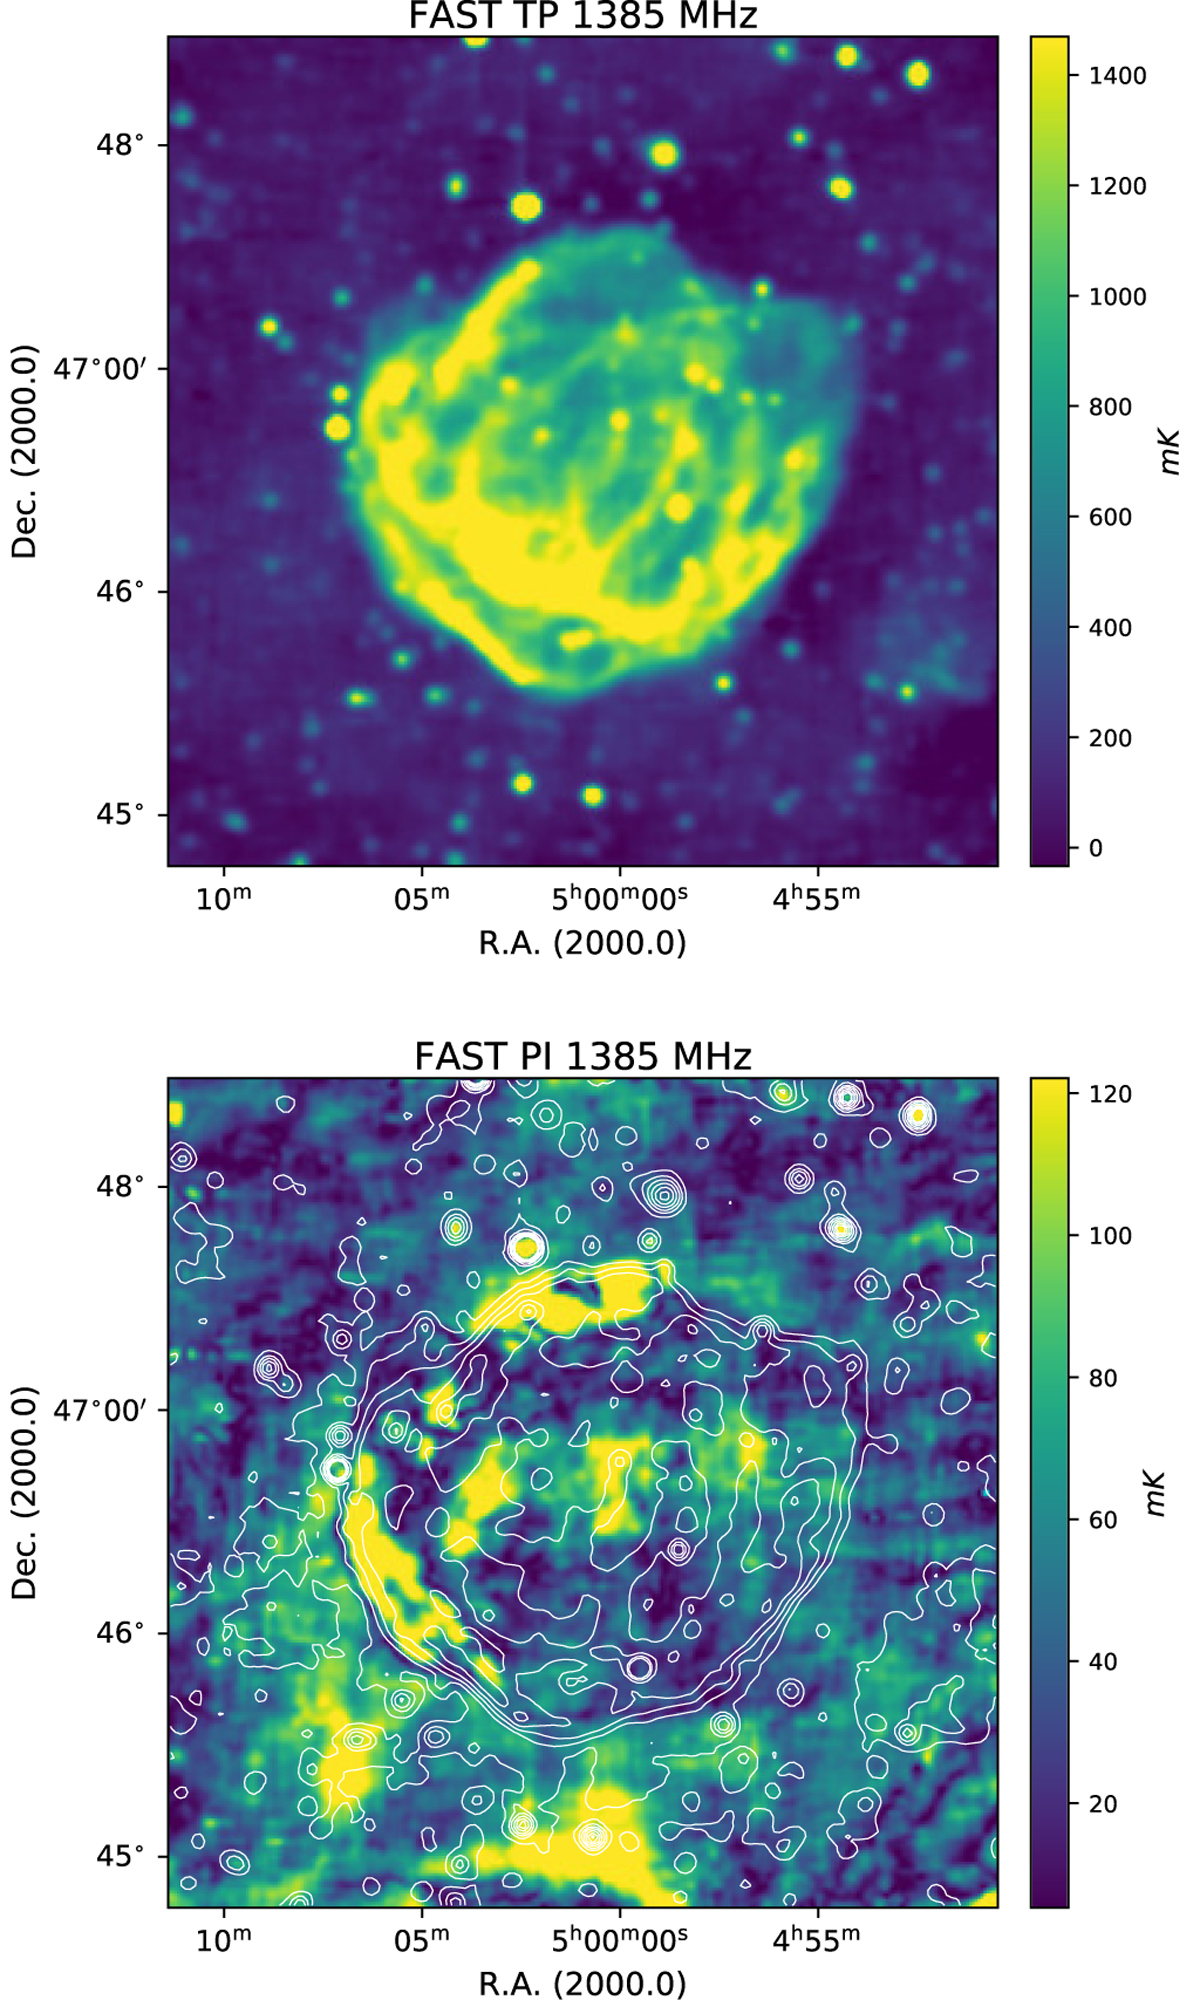
Fig. 1
Download original image
Top panel: FAST total-intensity map of HB 9 of subband2 at a central frequency of 1385 MHz. The angular resolution is 4′. Bottom panel: FAST subband2 polarized-intensity map of HB 9 at 1385 MHz. Contours show the total intensities of HB 9 at 150, 400, 700, and 1100 mK and further increase in steps of 500 mK.
Current usage metrics show cumulative count of Article Views (full-text article views including HTML views, PDF and ePub downloads, according to the available data) and Abstracts Views on Vision4Press platform.
Data correspond to usage on the plateform after 2015. The current usage metrics is available 48-96 hours after online publication and is updated daily on week days.
Initial download of the metrics may take a while.