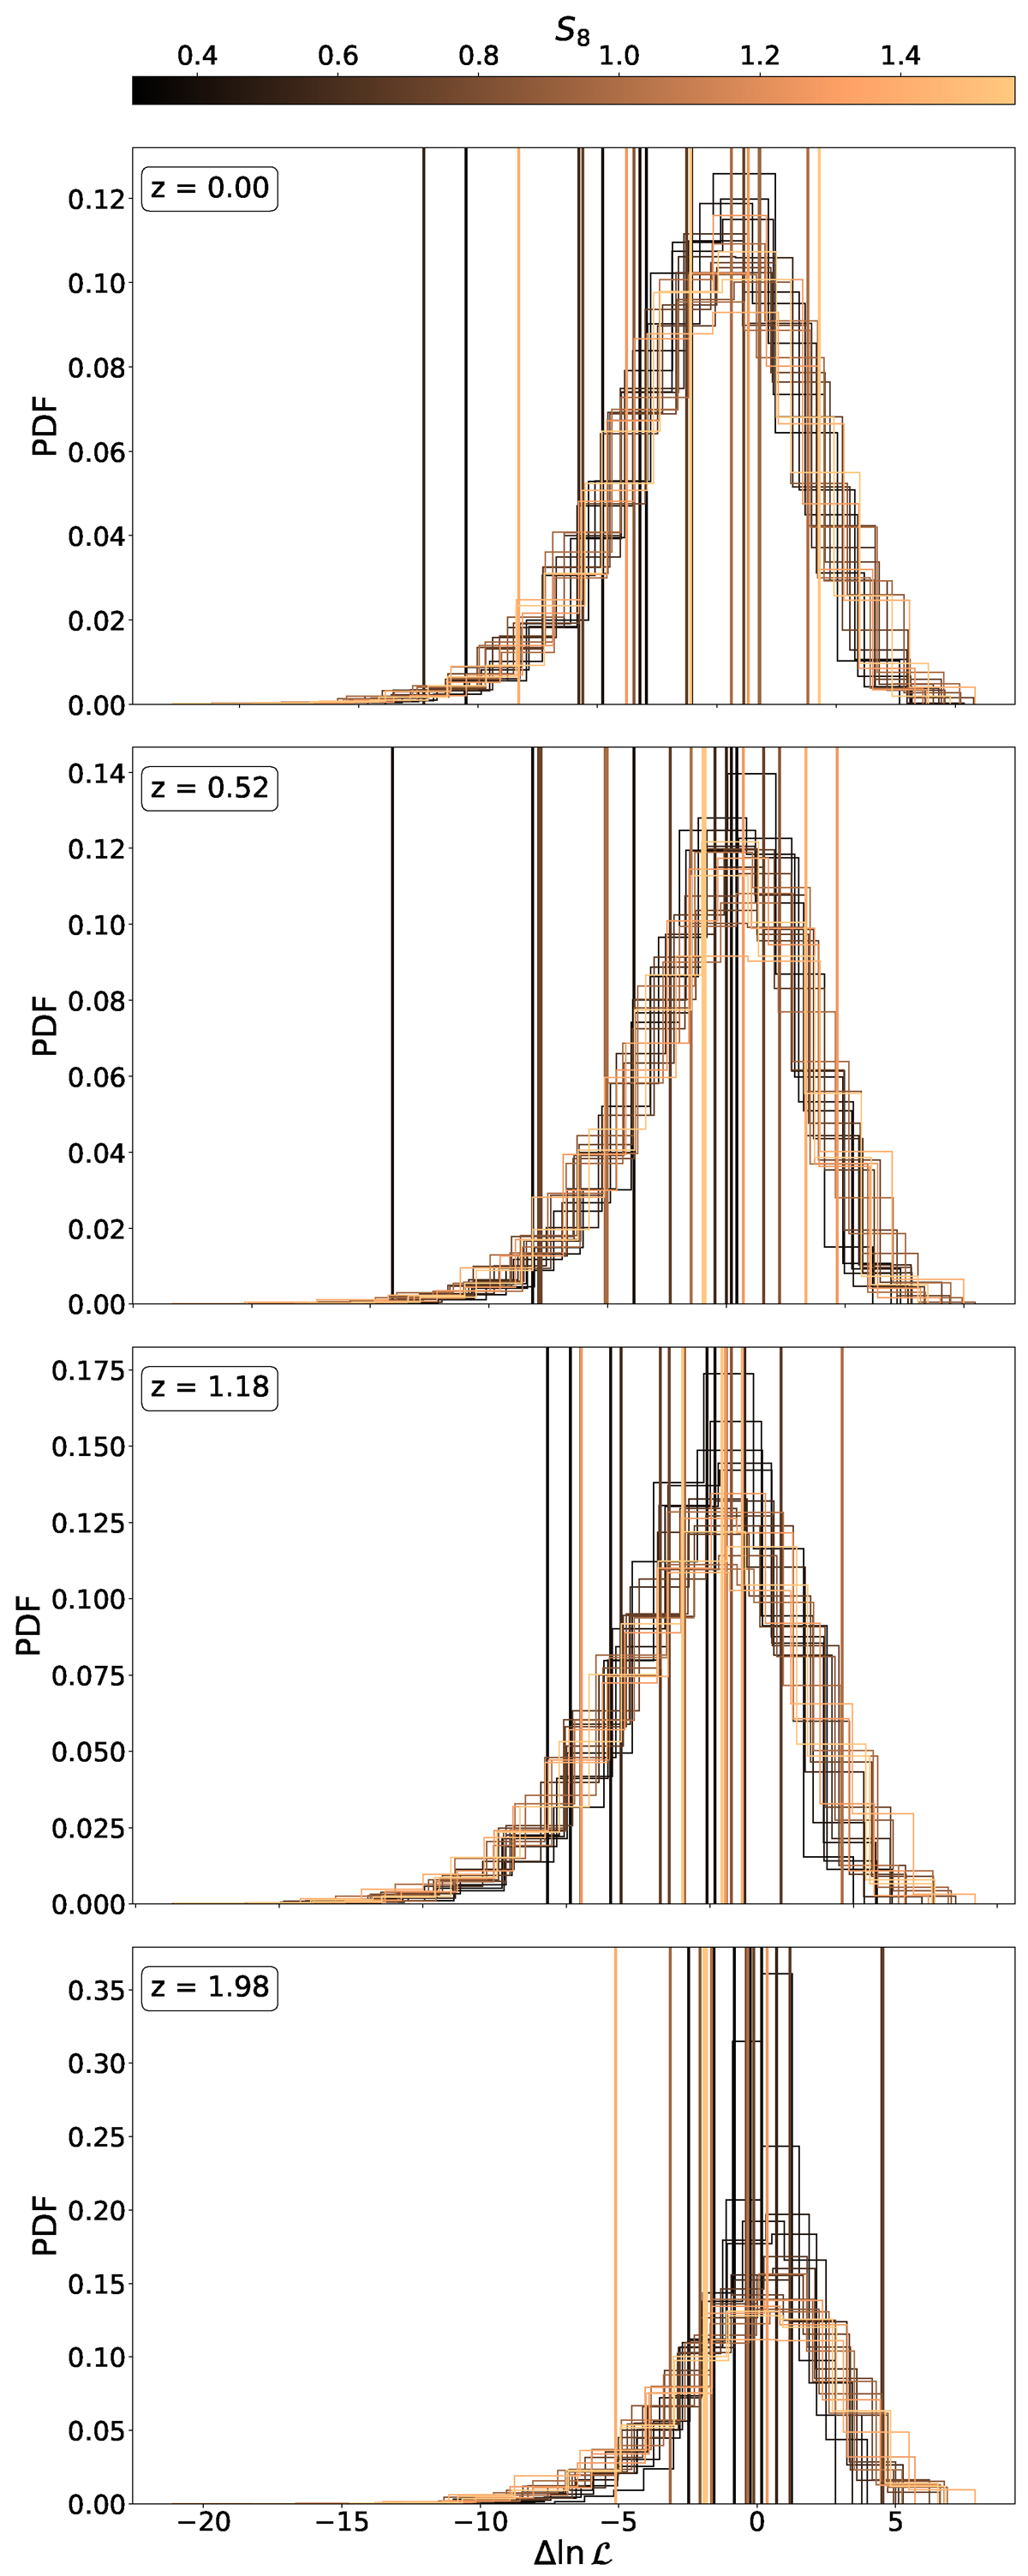
Fig. 6.
Download original image
Test p-value using the validation set of the DUCA simulations. For each catalog, we generated 3 × 10⁵ synthetic random samples from the likelihood and computed p as the fraction of samples with a likelihood value as extreme as the real catalog. The simulations have been color coded according to their S8 value. Each vertical line indicates the measured Δlnℒ for one of the validation simulations.
Current usage metrics show cumulative count of Article Views (full-text article views including HTML views, PDF and ePub downloads, according to the available data) and Abstracts Views on Vision4Press platform.
Data correspond to usage on the plateform after 2015. The current usage metrics is available 48-96 hours after online publication and is updated daily on week days.
Initial download of the metrics may take a while.