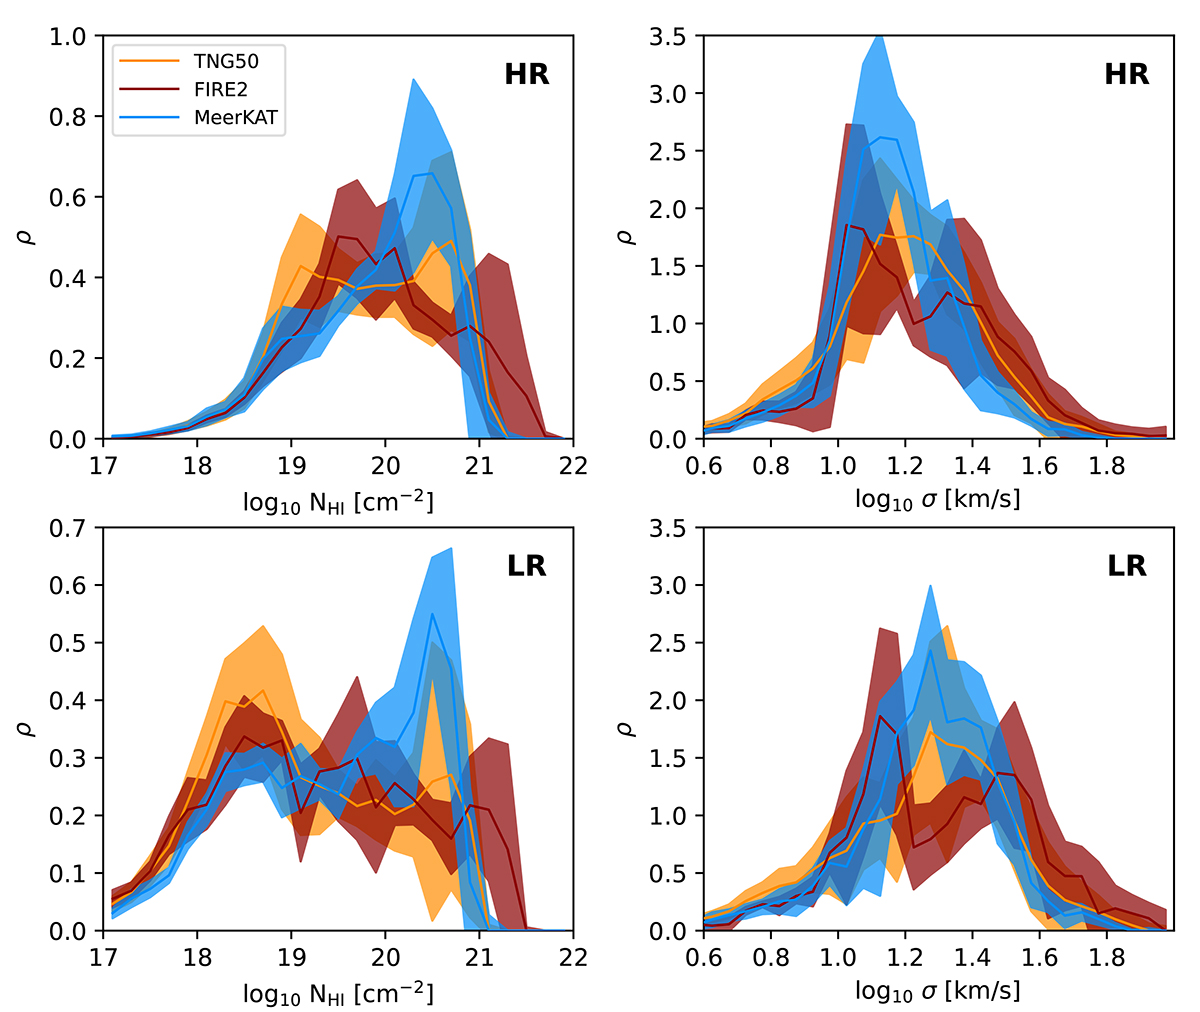
Fig. 6.
Download original image
Probability density distribution of inclination-corrected NHI values (left panels) and second moment values (right panels) for MeerKAT (blue), TNG50 (orange), and FIRE-2 (dark red curves) galaxies. The HR and LR cases are shown in the top and bottom panels, respectively. The solid lines show the median distribution for a given galaxy sample, while the shaded regions show the scatter within the sample, computed as the difference between the 84th and 16th percentiles.
Current usage metrics show cumulative count of Article Views (full-text article views including HTML views, PDF and ePub downloads, according to the available data) and Abstracts Views on Vision4Press platform.
Data correspond to usage on the plateform after 2015. The current usage metrics is available 48-96 hours after online publication and is updated daily on week days.
Initial download of the metrics may take a while.