Fig. 4.
Download original image
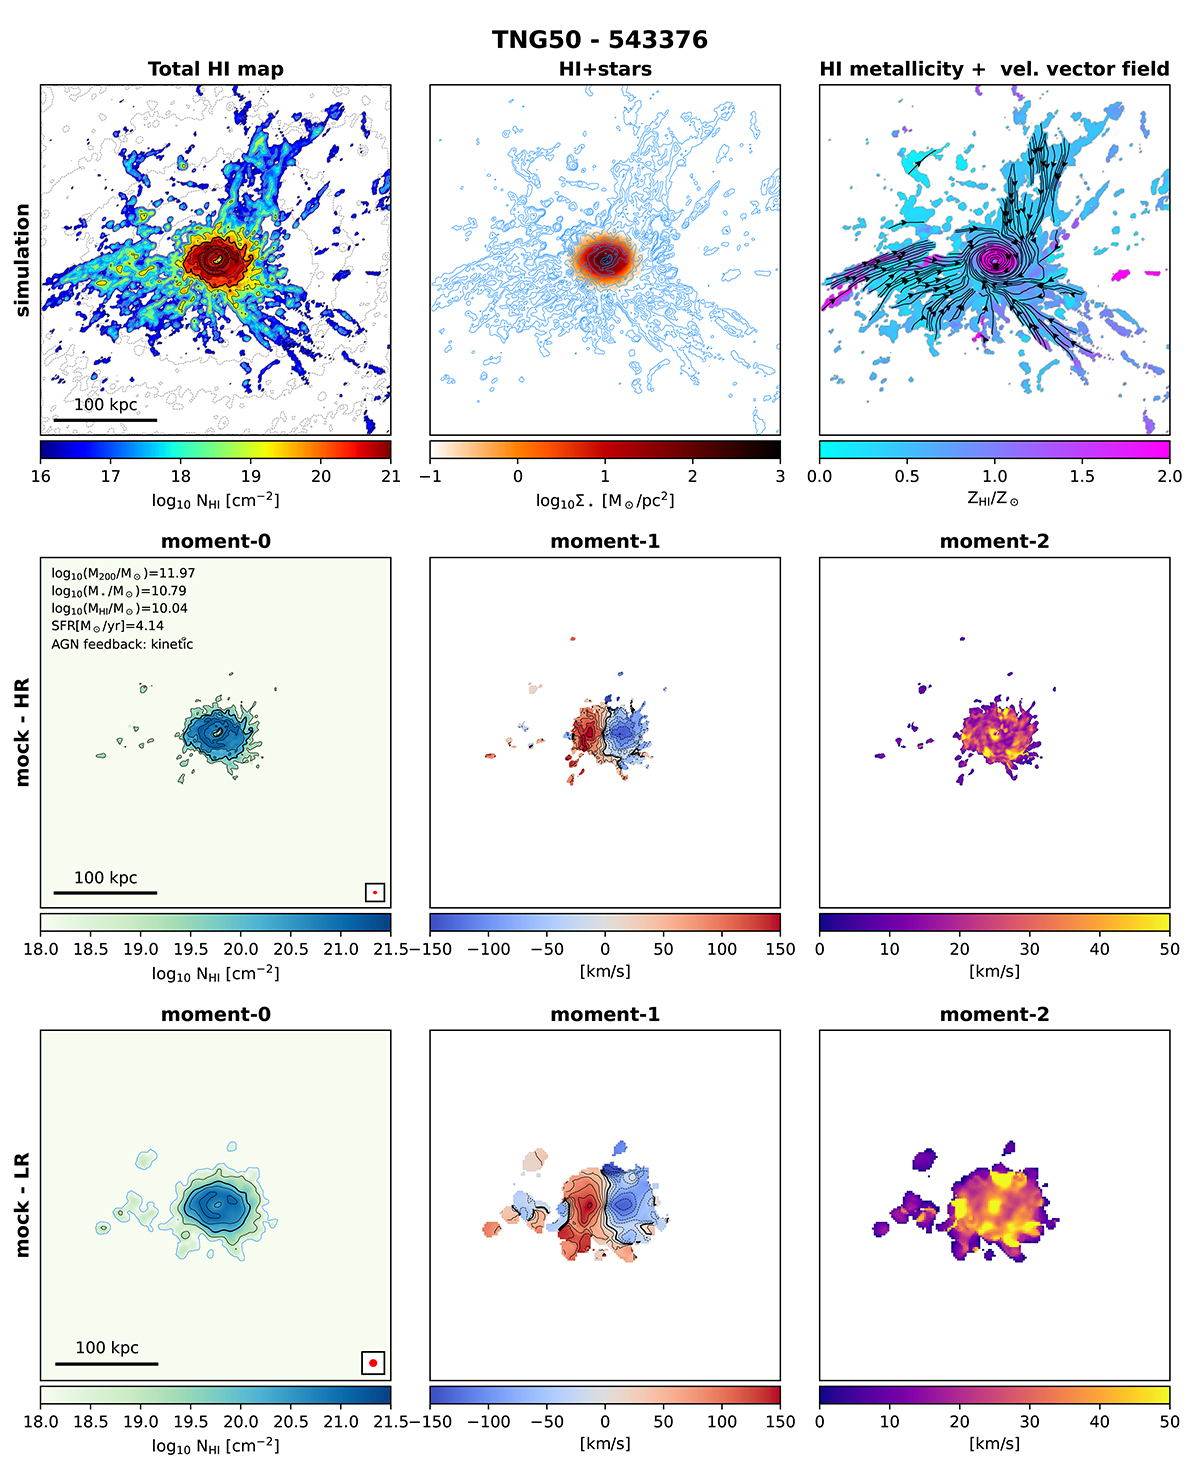
Diagnostic maps of galaxy 543376 in the TNG50 simulation. Top row: H I column density map down to a depth of 1016 cm−2 (left), stellar surface density map overlaid with H I contours (middle), H I metallicity map overlaid with the vector velocity field (right). Central and bottom rows: Moment maps for the HR (central) and LR (bottom) mock H I data, derived with SoFiA. The main galaxy properties are listed in the leftmost panel of the central row. The iso-contours in the NHI maps are drawn at levels of 1016, 1017 (in grey, top panel alone), 1018 (in blue, top and bottom panels), 1019, 1020, 1020.5, and 1021 cm−2 (in black, all panels), with the iso-contour at 1020 cm−2 highlighted with a thicker line. In the moment-1 maps, the contour at the systemic velocity is shown by a black line, and consecutive contours are spaced by 25 km s−1. The beam sizes are shown as red ellipses in the bottom right corner of the moment-0 maps. The dashed grey iso-contours in the top left panel trace the surface density distribution of the dark matter halo.
Current usage metrics show cumulative count of Article Views (full-text article views including HTML views, PDF and ePub downloads, according to the available data) and Abstracts Views on Vision4Press platform.
Data correspond to usage on the plateform after 2015. The current usage metrics is available 48-96 hours after online publication and is updated daily on week days.
Initial download of the metrics may take a while.