Fig. 3.
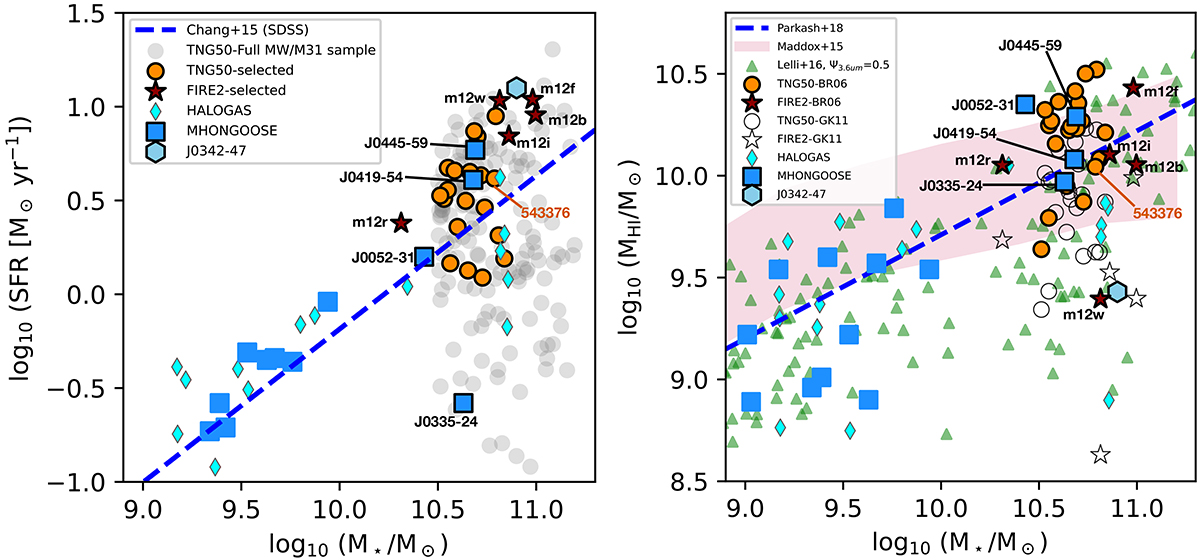
Download original image
Main scaling properties of the simulated galaxy samples compared to various observational datasets. Left panel: SFR vs M⋆ for MHONGOOSE (dB24, blue squares), J0342-47 (light blue hexagon), HALOGAS (Heald et al. 2011; Kamphuis et al. 2022, cyan diamonds), and our TNG50 (orange circles) and FIRE-2 (dark red stars) samples. The blue dashed line shows the SDSS main sequence from Chang et al. (2015). The grey circles show the other systems from the MW/M31 TNG50 sample of Pillepich et al. (2024). Right panel: MHI vs M⋆. The markers are as in the left panel, with the addition of the SPARC sample (Lelli et al. 2016, green triangles). The purple-shaded area shows the ±1σ confidence region around the median scaling found by Maddox et al. (2015), while the blue dashed line shows the linear fit to the H I-WISE data from Parkash et al. (2018). Masses for the simulated galaxies are computed within 100 kpc from their centre. Black-edged markers are used for systems that are studied in this work. For comparison, we also show the simulated galaxies with H I masses computed with the recipe of Gnedin & Kravtsov (2011) (empty stars and circles).
Current usage metrics show cumulative count of Article Views (full-text article views including HTML views, PDF and ePub downloads, according to the available data) and Abstracts Views on Vision4Press platform.
Data correspond to usage on the plateform after 2015. The current usage metrics is available 48-96 hours after online publication and is updated daily on week days.
Initial download of the metrics may take a while.