Fig. 18.
Download original image
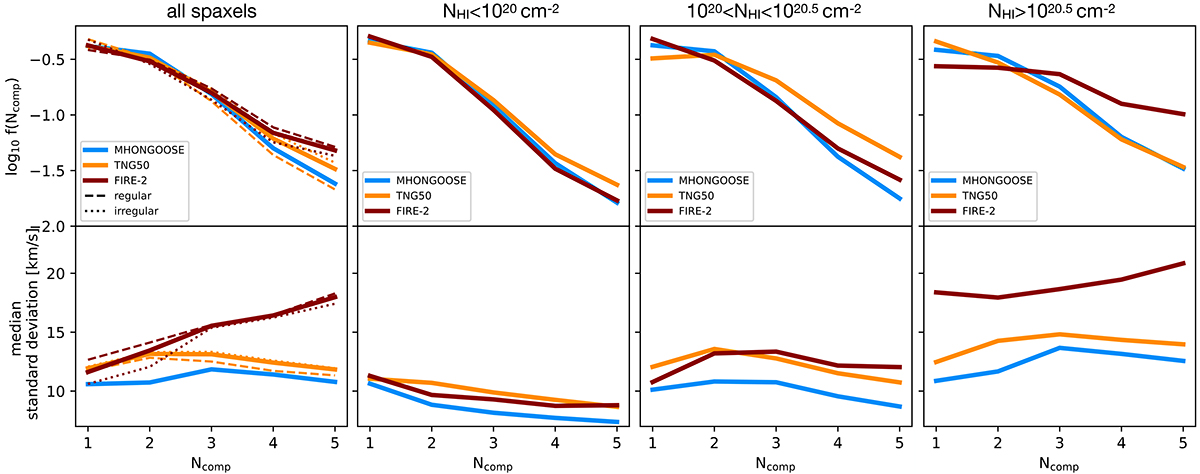
Results of our multi-Gaussian fitting for the TNG50 (orange), FIRE-2 (dark red), and MeerKAT (blue) galaxies. Top panels: Fraction of spectra modelled with N components (1 ≤ N ≤ 5). Bottom panels: Median value of the distribution of the Gaussian standard deviations computed for all line profiles modelled with N components, as a function of N. The different panels show our results for spaxels in different ranges of (inclination-corrected) H I column density, indicated at the top of each panel. The dashed and dotted curves in the leftmost panels show, respectively, the regular and irregular populations of simulated galaxies.
Current usage metrics show cumulative count of Article Views (full-text article views including HTML views, PDF and ePub downloads, according to the available data) and Abstracts Views on Vision4Press platform.
Data correspond to usage on the plateform after 2015. The current usage metrics is available 48-96 hours after online publication and is updated daily on week days.
Initial download of the metrics may take a while.