Fig. 17.
Download original image
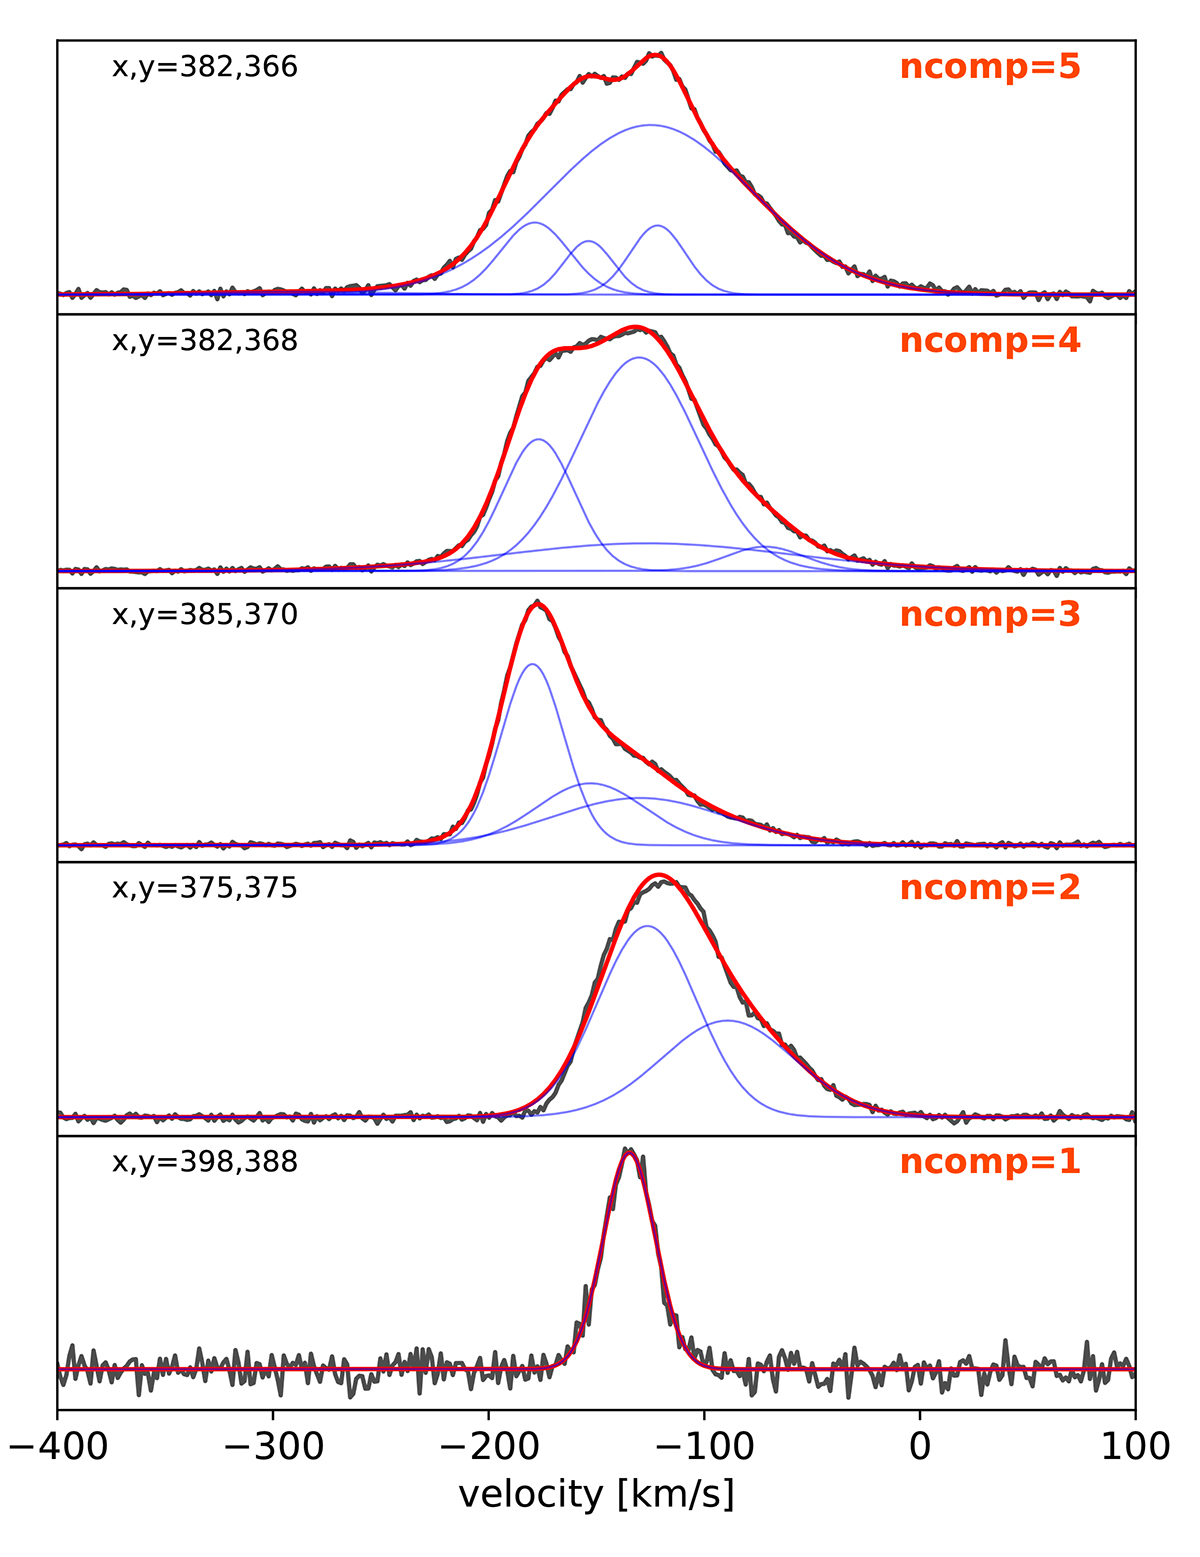
Representative H I spectra for the FIRE-2 galaxy m12f (HR), extracted at the pixel positions indicated in the top left corner of each panel. The grey lines show the mock H I spectra, the red lines show the best-fit multi-Gaussian models, the blue lines show the individual Gaussian components. The number of components used is indicated in the top right corner of each panel.
Current usage metrics show cumulative count of Article Views (full-text article views including HTML views, PDF and ePub downloads, according to the available data) and Abstracts Views on Vision4Press platform.
Data correspond to usage on the plateform after 2015. The current usage metrics is available 48-96 hours after online publication and is updated daily on week days.
Initial download of the metrics may take a while.