Fig. 16.
Download original image
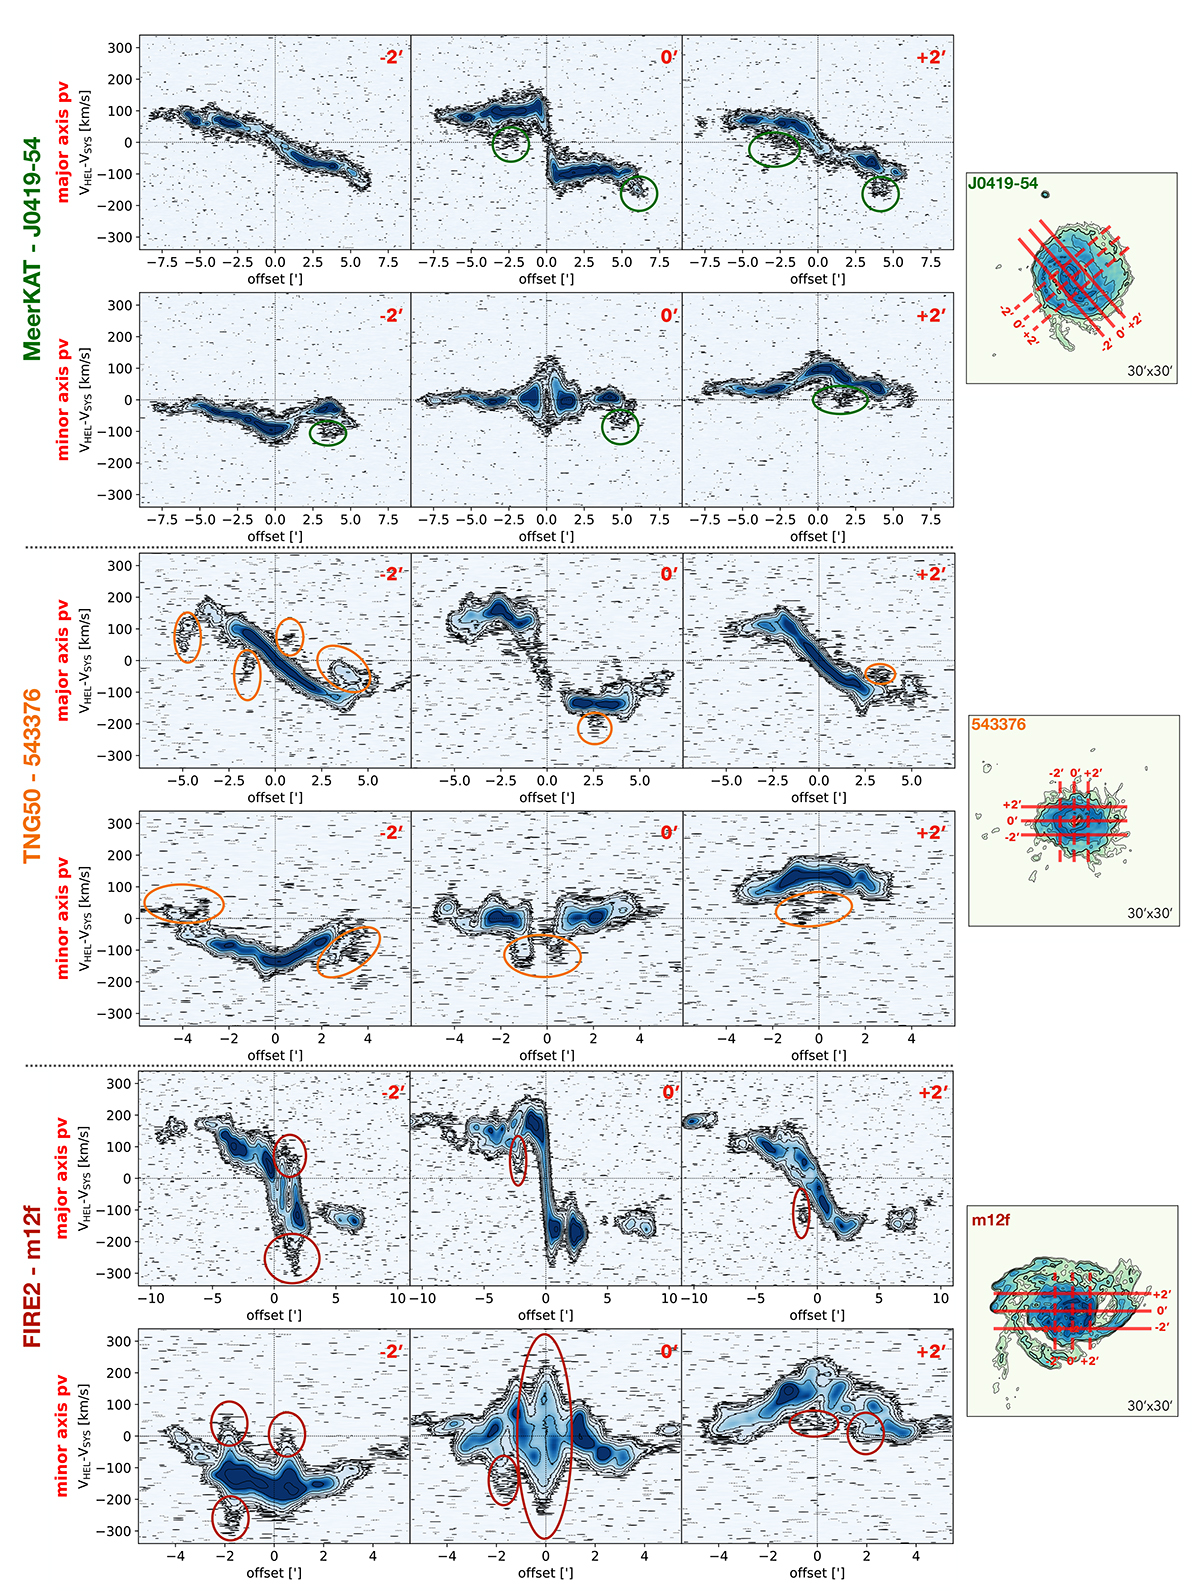
H I position-velocity diagrams on slices parallel to the kinematic major and minor axes (first and second rows of each panel set) for J0419-54 (top panels), the TNG50 system 543376 (central panels), and the FIRE-2 system m12f (bottom panels) for the HR case. All panels show the same velocity range on the y-axis. The slice thickness is four pixels (20″). Slice offsets are indicated on the top right corner of each panel. Contours are spaced by powers of two, the outermost being at an intensity level of 0.3 mJy beam−1 (2σnoise). A negative contour (−2σnoise) is shown in grey. The circles highlight the anomalous kinematic features. The rightmost panels show the total H I maps with the cuts parallel to the major and minor axes (solid and dashed lines, respectively) used in the pv-slices.
Current usage metrics show cumulative count of Article Views (full-text article views including HTML views, PDF and ePub downloads, according to the available data) and Abstracts Views on Vision4Press platform.
Data correspond to usage on the plateform after 2015. The current usage metrics is available 48-96 hours after online publication and is updated daily on week days.
Initial download of the metrics may take a while.