Fig. 11.
Download original image
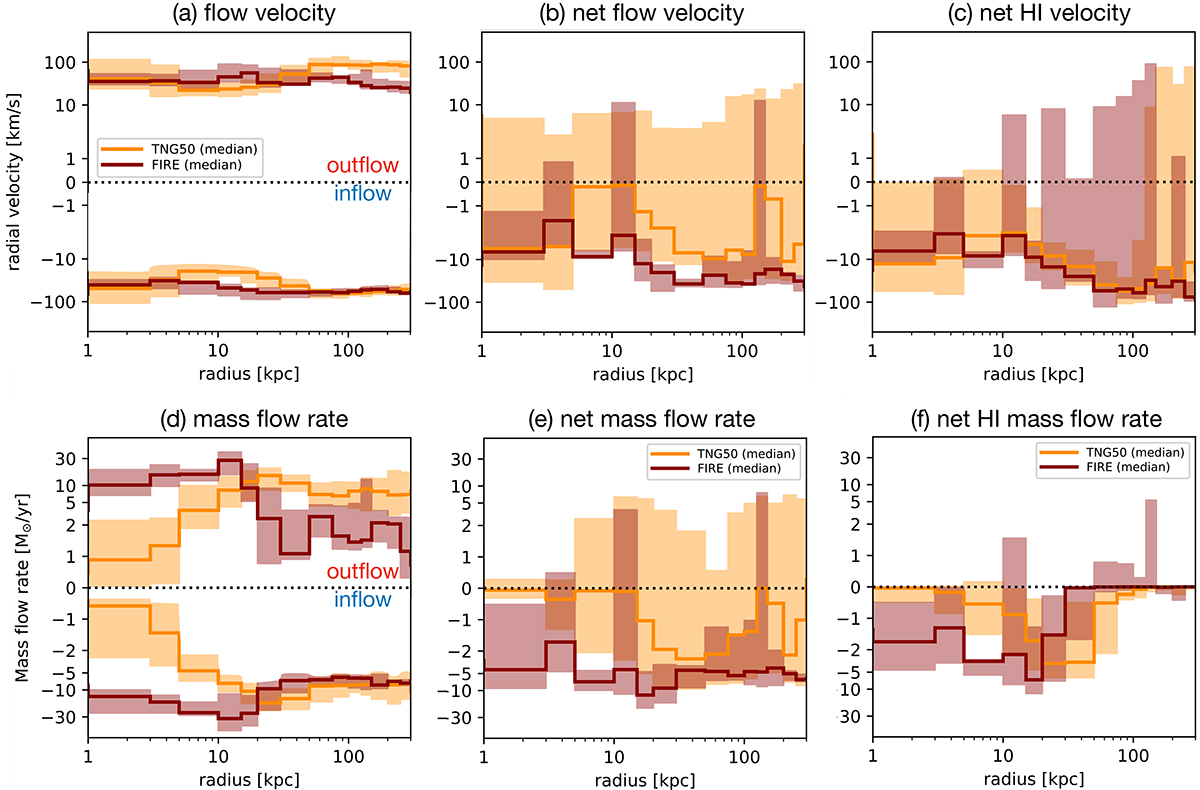
Radial velocities (top panels) and gas mass flow rates (bottom panels) computed in spherical concentric shells, as a function of the shell radius, for the TNG50 (orange) and FIRE-2 (dark red) galaxies. Panels (a) and (d) show the inflow and outflow components separately, panels (b) and (e) show the net (outflow-inflow) flow for all gas phases, panels (c) and (f) show the net flow for the H I alone. The thick lines show the median trend, while the shaded areas show the difference between the 84th and 16th percentile. Negative values indicate inflow.
Current usage metrics show cumulative count of Article Views (full-text article views including HTML views, PDF and ePub downloads, according to the available data) and Abstracts Views on Vision4Press platform.
Data correspond to usage on the plateform after 2015. The current usage metrics is available 48-96 hours after online publication and is updated daily on week days.
Initial download of the metrics may take a while.