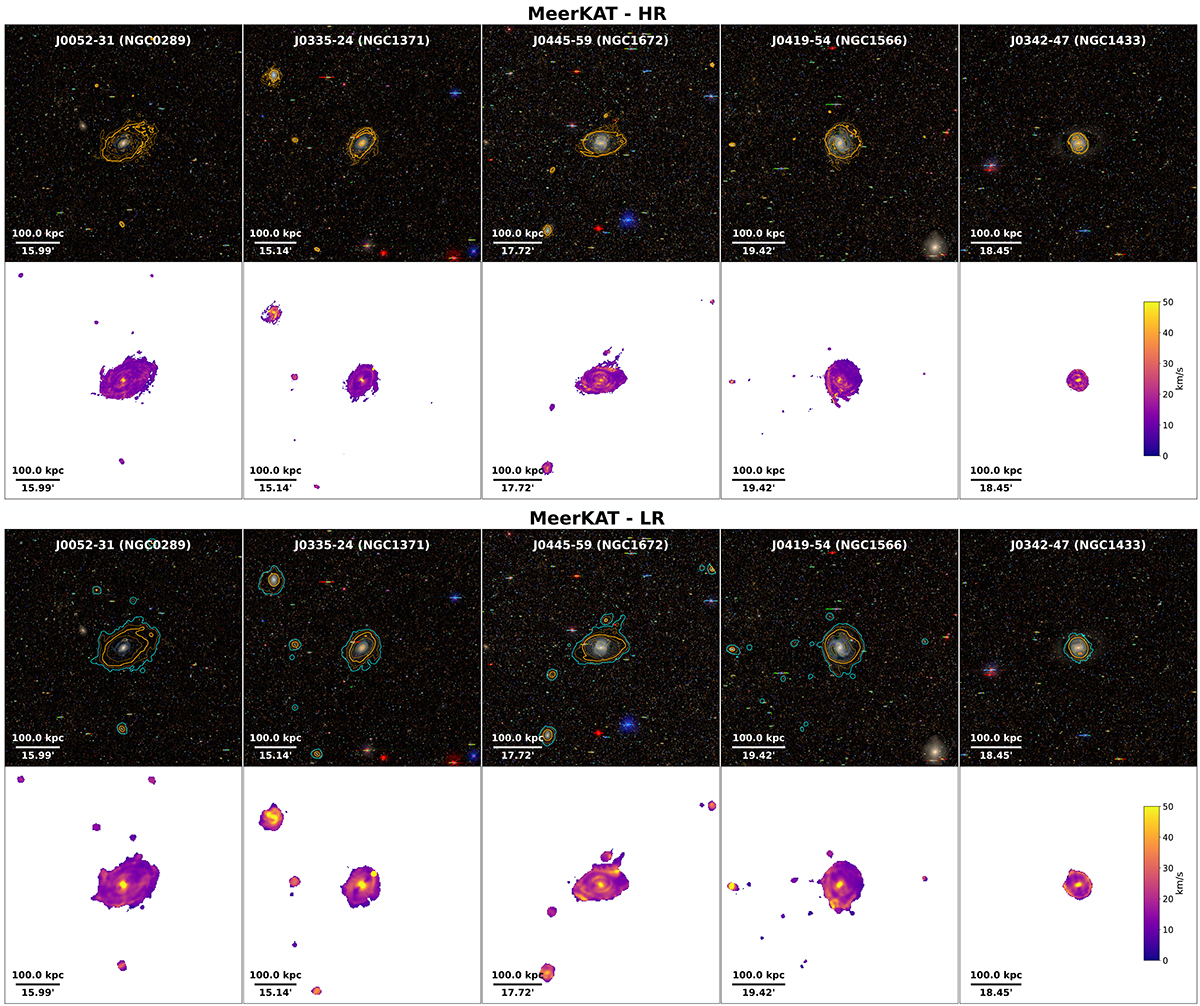
Fig. 1.
Download original image
MeerKAT galaxy sample studied in this work. The high-resolution (∼22″) and low-resolution (∼65″) cases (HR and LR) are shown separately in the top and bottom parts of the figure. Top panels: H I column density iso-contours overlaid on top of grz colour-composite images from the DESI Legacy Imaging Surveys (Dey et al. 2019). Contours are drawn from primary-beam corrected moment-0 maps at NHI levels of 1019, 1020 (thicker line), 1020.5, and 1021 cm−2. The LR panels show an additional contour at the level of 1018 cm−2, in cyan. Bottom panels: Moment-2 maps. The velocity colour scheme is shown in the rightmost panels.
Current usage metrics show cumulative count of Article Views (full-text article views including HTML views, PDF and ePub downloads, according to the available data) and Abstracts Views on Vision4Press platform.
Data correspond to usage on the plateform after 2015. The current usage metrics is available 48-96 hours after online publication and is updated daily on week days.
Initial download of the metrics may take a while.